 Two groups of researchers explore tropical forest plots with DNA barcodes in October 2009 PLoS ONE and Proc Natl Acad Sci USA (both open access, the latter Twittered!). It is just three months ago a community standard for DNA barcoding land plants was announced, namely the plastid genes rbcL and matK, with species-level identification in 72% of cases tested and identification to “species groups” in the remainder. The two papers mentioned above represent the early roll-out so we can expect much more will be learned about DNA barcoding in plants in particular and about plant biology in general.
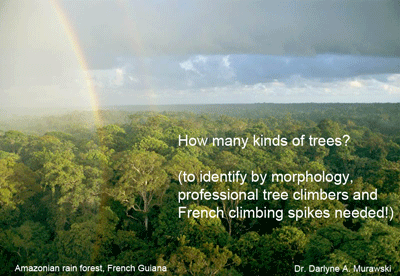
In PLoS ONE, researchers from France, French Guiana, and New York apply DNA barcoding to two 1-hectare plots in the “pristine lowland tropical rainforest” of central French Guiana, which represents one of the largest tracts of intact Amazonian rainforest. Working out of the Nouragues Research Station (“gateway to European rainforest”) Gonzales and colleagues collected leaf and cambium (living outer layer of wood) samples from all trees 10 cm or greater in diameter, with the assistance of professional tree climbers for large trees and use of climbing spikes for smaller specimens. The extreme efforts required to collect morphologically-identifiable specimens highlights the desirability of a DNA-based approach that could be applied nearer to ground level! A total of 1073 trees were sampled, which were sorted into 301 morphospecies; of these, 254 (85%) were “matched to a reference voucher with an acceptable species name…[encompassing] 143 genera and 54 angiosperm families, so that is a lot of tree diversity! For comparison there about 1000 native tree species in all of North America. PCR was carried out for multiple loci: in addition to above-mentioned standards rbcL and matK, these included plastid genes rpoC1, rpoB, and ycf5, non-coding trnL and psb-trnH, and nuclear ITS. The researchers also applied DNA barcoding to “juveniles” i.e. saplings in the same plots, of which just 27% could be identified to species, plus another 45% to morphotype, and 11% to genus (this leaves 17% not identified to genus). Not surprisingly given the diversity of species, sample types, markers, and uncertainties in the underlying taxonomy, the researchers’ results are complex. Regarding tissue types, they obtained amplifiable DNA from most or all leaf and cambium samples, with high success for some markers (e.g., rbcL sequencing rate 93%), supporting ground-level sampling strategies. Regarding markers, they had difficulty amplifying matK (68% success) and ITS (41%). Similar to prior observations, the overall rate for species-level identification using plastid markers plateaued at about 70%, thus two loci capture most of what is available from this genetic compartment.
In Proc Natl Acad Sci USA, researchers from Smithsonian Institution, Smithsonian Tropical Research Institute (STRI), Imperial College, and Harvard University apply DNA barcoding with rbcL, matK, and trnH-psbA to 1035 tree samples representing 296 species in STRI’s 1,000 x 500 m Forest Dynamics Plot on Barro Colorado Island, Panama. They had similar sequencing success to Guiana study (rbcL, 93%; trnH-psbA, 94%; matK, 69%). Overall success at species-level identification was 92% for rbcL + matK; 95% for rbcL + trnH-psbA, and 98% for all three markers, with the denominator in these comparisons apparently being #samples with available sequences. I am uncertain as to why species-level identification was higher in Panama as compared to Guiana study; the total number of samples and species is similar so presumably this reflects particular aspects of the species composition such as recent radiations in these locations. Kress and colleagues constructed a supermatrix with this data, generating a “robust community phylogeny for 281 of the 296 species in the plot.” They conclude “DNA barcodes stand poised to serve as an efficient and effective approach to building community phylogenies…[aiding] understanding niche conservation and the dynamics of species composition at landscape and global scales.” Sounds promising!

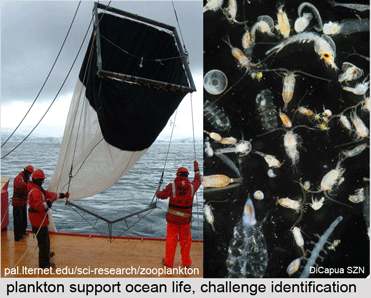 Marine zooplankton comprise an enormous mass of diverse organisms distributed throughout the world’s oceans from deep waters to surface. Zooplankton include representatives of at least dozen phyla, some of which are larval forms of much larger animals, and challenge identification with their diversity and tiny size. In
 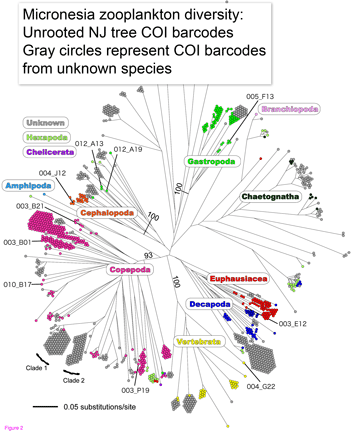 Machida and colleagues found evidence for 189 species, only 10 of which could be confidently matched to reference sequences. This report demonstrates that this sort of “kitchen blender” approach, which has previously been applied largely to bacterial and archaeal communities, shows promise for assemblages of eukaryotes and reveals surprisingly few organisms have reference sequences in databases. Identified organisms included several copepods as well as presumably larval forms of
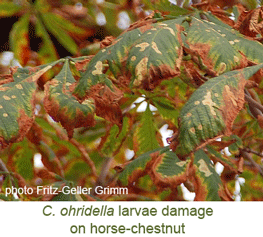 The horse-chestnut leaf miner moth Cameraria ohridella (link to
 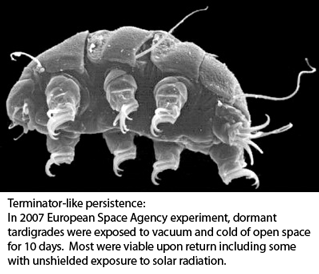 Tardigrades, commonly called water bears, are tiny (0.1-1.5 mm) water-dwelling invertebrates found in diverse environments. About 1000 species are known. Morphologic identification is difficult and may be limited to certain life stages–some species can be identified only from eggs, for example. Tardigrades can transform into a dormant state with remarkable ability to withstand extreme drying, cold, and radiation for prolonged periods, making them of interest for persons studying biology of tissue repair, aging and other fields.
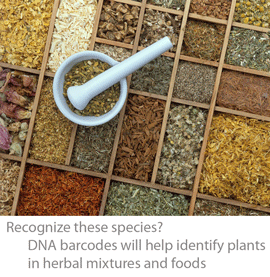 “DNA barcoding involves sequencing a standard region of DNA as a tool for species identification. However, there has been no agreement on which region(s) should be used for barcoding land plants. To provide a community recommendation on a standard plant barcode, we have compared the performance of 7 leading candidate plastid DNA regions (atpF–atpH spacer, matK gene, rbcL gene, rpoB gene, rpoC1 gene, psbK–psbI spacer, and trnH–psbA spacer). Based on assessments of recoverability, sequence quality, and levels of species discrimination, we recommend the 2-locus combination of rbcL and matK as the plant barcode. This core 2-locus barcode will provide a universal framework for the routine use of DNA sequence data to identify specimens and contribute toward the discovery of overlooked species of land plants.”
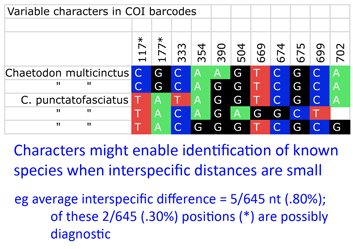 Back to the study, Steinke and colleagues found distinct barcodes among 384/391 (98.2%); 9 species displayed 2 or 3 distinct clusters, most of which were allopatric. Review of these potential “splits” revealed possible inappropriate synonymization in several cases. On the other side, 2 pairs and 1 triplet of species were not distinguished by DNA barcodes using distance. I look more closely at one of these examples, butterfly fishes Chaetodon multicinctus and C. punctatofasciatus, to see if there might be diagnostic characters whose signal is swamped by intraspecific variation. As in figure, there are 2 possibly diagnostic differences among this species pair. Of course, this sort of analysis only works for known species, but I wonder how many other species pairs/sets with “overlapping” barcodes have diagnostic differences.