Simplified DNA barcode recipe-skip step one

It used to be standard practice to shave the area around the incision before surgery, as it was thought that hair harbored bacteria that would cause wound infection. Beginning in the 1970s, doctors found this was unnecessary, and in fact was associated with higher incidence of post-operative infection. This history comes to mind in reading March 2010 BioTechniques report by researchers from University of Guelph demonstrating that DNA suitable for PCR and sequencing can be obtained simply by leaving specimens in alcohol overnight!

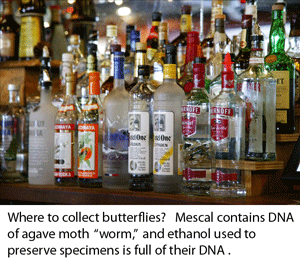
well-stocked-bar-tavernOf the three steps required to get from a specimen to a DNA barcode, namely DNA isolation, PCR (polymerase chain reaction), and sequencing, the first step is the most labor intensive and hardest to automate. Numerous protocols/kits have been developed to optimize DNA isolation from various types of specimens, such as plant vs animal tissues. As described by the Guelph researchers, “these procedures force cells to release their DNA via physical pertubation and/or chemical treatment, which is then followed by a clean-up procedure in which unwanted cellular compoents are separated from the DNA.” The researchers “hypothesized that a small amount of DNA leaks from the tissue into the preservation solution (usually ethanol), and that this DNA was amplifiable using a standard PCR protocol.” To start, they analyzed Monte Alban mescal, which is sold with a “worm” (a caterpillar of the agave moth, Hypopta agavis) in each bottle. They evaporated 50 mL mescal, re-dissolved the residue in water, applied this to a Qiagen MinElute spin column, resuspended the product in 50 ?L water, and used 2 ?L of resulting solution in a standard 25 ?L PCR reaction, with successful amplification and sequencing of 130 base mini-barcode of COI. This case was presumably challenging as mescal is only 40% ethanol and contains a variety of material that might inhibit PCR. In subsequent tests, 1 mL of 95% ethanol used to preserve specimens was evaporated, resuspended in 30 ?L of water without column purification, and 2 ?L used for PCR.
By evaporating 1 mL of ethanol in which specimens had been stored overnight (out of 2 mL total ethanol volume) and re-suspending residue in water, Shokralla and colleagues amplified and sequenced 130-base and 650-base fragments of COI and 1100-base fragment of 28s RNA from 25 whole insect specimens (mayflies, caddisflies; 1 gave COI only) and rbcL from 45 plant specimens (0.5 mm leaf samples). They also obtained COI sequences by sampling 1 mL of ethanol solution from 7 insect specimens stored at room temperature for 7 to 10 years. The researchers note this approach could facilitate for “high-throughput” analyses, as it involves liquid handling which is easy to automate, avoids destructive sampling, and could be used even when “there is simply no sample left for further analysis.” They conclude with a caution about “field sampling procedures that include placing mixtures of specimens in an ethanol jar” as this “may increase the chance of cross-contamination.”

The remarkably simple procedure reported by Shokralla and colleagues offers benefits to many persons who want to get DNA barcode identifications. I look forward to applications of this method in research and commercial laboratories, classrooms, and perhaps kitchens!

For accurate census, birds await their barcodes

sdarticle08-2bAlthough birds have been studied in more detail than any other large group of animals, mtDNA continues to reveal many overlooked species, such that named taxa turn out to be comprised of two or more distinct species. These revisions include some very familiar birds, e.g., Canada Goose, which was recently recognized as comprising two species, Cackling Goose (B. hutchinsii) and Canada Goose (B. canadensis) (A.O.U. Check-list 45th suppl. 2004); for a current example, see Päckert et al Mol Phylogenet Evol 2010).  Although such taxonomic revisions reflect a combined analysis of morphological, behavioral (particularly song), geographic range, and DNA information, to my reading mtDNA generally trumps the other data, which mostly serve as corroborating evidence.  It is not that mtDNA similarities or differences are important per se, it is that they are strongly predictive of the presence or absence of organismal differences, particularly reproductive isolation, that are the hallmarks of species status. Of the species examined so far (I estimate about 1/3 of the 10,000 world birds), most demonstrate a similar patterning of limited mtDNA differences within species and relatively large differences among species, so we can be confident that this analytic approach will hold up.  As an aside, referring to splits of named species as “taxonomic inflation” is misleading, as it suggests the real number of species is already known, which seems no more correct than referring to binary stars resolved with a new telescope as reflecting “stellar inflation.”
As with most animal groups, there are no nuclear genes that regularly distinguish closely-related birds. (It seems likely that sequencing entire nuclear genomes will enable discriminating species units, but this is inherently a more costly, less standardizable approach, making it unattractive for routine use.) Differences among closely-related species are more or less evenly-distributed throughout the mitochondrial genome, so that approximately 500-1000 bp of coding DNA usually contains sufficient information to recognize species and create genus-level phylogenies. Moreover, if species are not distinguished by this length of mtDNA then additional sequencing usually does not improve the resolution. This might be better stated the other way around, namely, if two sets of birds cannot be distinguished by a relatively short stretch of mitochondrial DNA, then they most likely belong to the same species.  Why is this so? The prevailing null hypothesis is that mitochondrial differences are an accidental if useful accompaniment to species status, reflecting genetic drift over the several hundred thousand years of reproductive isolation presumably required for new species to emerge. In a recent essay  (Nature 18 nov 2009), Nick Lane explores the interesting possibility that mitochondrial differences cause speciation, thus producing what they identify.

What barcoding adds to the historical approaches in avian systematics is standardization, so that the same locus is analyzed in every specimen, which speeds completion of species-level avian taxonomy and facilitates large-scale comparisons. Given that most bird species have yet to analyzed for species-level genetic differences, the standardized approach can save considerable time and money, as the results of independent investigators can be readily merged (e.g. Johnsen et al J Ornithol 2010, Kerr et al Frontiers Zool 2009). Beyond classification, this approach creates a reference library of avian barcodes, which enables identifying unknown specimens, such as from birdstrikes (Marra et al Frontiers Ecol Environ 2009). Our survey of avian frozen tissue collections identified over 315,000 specimens representing over 7,200 species (Stoeckle and Winker, Auk 2009). Based on what is in GenBank, it appears that most of these specimens have never been analyzed for any genetic locus, so a first-pass effort to sequence COI barcode region will certainly reveal many new species and help resolve higher-level relationships as well. There is an opportunity for a granting agency or foundation to have a large impact on avian systematics for modest cost by supporting barcoding of existing collections, given that the tissue specimens and vouchers, which are the most expensive components of collections, have already been prepared.  Looking further ahead, such an effort would also create sets of high-quality  DNA extracts,  with species identity confirmed by COI barcode, linked to vouchered specimens, that would be a powerful resource for further genetic study.

News about mitochondria

Mitochondria are energy-producing organelles, found in nearly every cell in nearly every plant and animal species (some protozoans lack mitochondria).  As first demonstrated by Lynn Margulis in 1967 (J Theor Biol 14:225) mitochondria, like chloroplasts, are derived from bacteria, reflecting an ancient symbosis that pre-dates the divergence of plant and animal species 1 billion years ago. Both organelles have retained a truncated circular genome and replicate independently of the nucleus. The mitochondrial genome in particular has turned out to be exceedingly useful in tracing evolutionary history, as it is present in all eukaryotic organisms, evolves rapidly as compared to nuclear DNA, and does not undergo meiosis and recombination, processes that scramble the evolutionary lineages of nuclear genes. Because it is several orders of magnitude more abundant than nuclear DNA (hundreds to thousands of mitochondria per cell, and 5 to 10 genomes per mitochondrion), it facilitates forensic identification, including DNA barcoding, even with very small or degraded samples. Given its practical and scientific importance, we want to better understand mitochondrial genetics.

A general observation is that mitochondrial DNA is uniform in an individual, presumably reflecting a stringent bottleneck at oogenesis, such that one or a very small number of mitochondria are passed on. However, a number of cases of heteroplasmy (i.e., individuals harboring multiple mitochondrial variants) are reported in humans and other animals.  In 3 March 2010 Nature researchers from Johns Hopkins University and Case Western University apply next-generation sequencing to make a high-resolution survey of mitochondrial heteroplasmy in various tissues including cancerous cells. He and colleagues used “two sets of PCR primers, each resulting in amplicons of about 650 base pairs (bp) in length…to cover the mtDNA genome” and the resulting PCR products were sequenced by synthesis in an Illumina GAII. This approach was applied to a sample of normal colonic mucosa, yielding “8.5 million tags that matched the mitochondrial genome.” As a result, “each mtDNA base was sequenced, on average 16,700 times and fewer than 11 bases (0.07%) of the 16,569 bp in the mtDNA genome) were represented fewer than 1,000 times.”

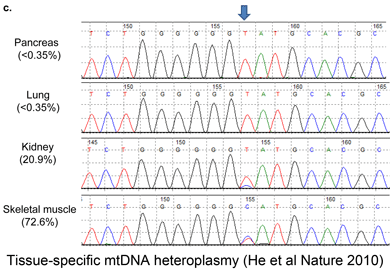
nature08802yTo establish a cutoff for artefactual errors due to PCR and/or sequencing, a control comparison with amplified nuclear DNA was performed, which yielded an average of 0.058% (SD 0.057%) mutations per base and a maximum of 0.82% mutations. He and colleagues used a “very conservative assumption that all variants in excess of twice this value (1.6%) represented true heteroplasmies rather than sequencing artefacts.” Now to some results! The researchers detected “28 homoplasmic alleles and 8 heteroplasmic alleles in this sample of normal colonic mucosa.” Here “homoplastic” refers to differences from the reference human mtDNA sequence (NCBI entry NC_012920). All of the homoplastic alleles were previously found in normal individuals, so we can set these aside as representing normal variation among human individuals.
The researchers extended this analysis to other tissues from same individual; all tissues yielded heteroplasmic mtDNA, and the proportion of of individual variants differed strongly among tissues, e.g., the frequency of the most common variant ranged from 7.4% in skeletal muscle to 90.9% in kidney. Surprisingly, 75% of the heteroplasmic variants are already reported in human databases, suggesting a limited pool of variation and/or strong purifying selection. Further evidence for restricted variation is that 67% of heteroplasmic variants were in non-protein coding or RNA-coding regions,” presumably the control region, which represents less than 10% of the mitochondrial genome.

What is the origin of heteroplasmic mtDNA? Using samples from one kindred, the researchers found identical variants in a mother and her two children (and not in the father), demonstrating that, at least in this case, the heteroplasmic variants were inherited from the mother. The authors go on to analyze mitochondrial heteroplasmy in cancerous tissue which is interesting but I will not discuss here.

In terms of species-level identification, the findings add confidence to the established approach using COI mtDNA for animals. This high-resolution study demonstrates that mitochondrial variation within human individuals is a smaller scale version of the variation already known to exist among individuals. As in standard mitochondrial genetics, most of the heteroplasmic variants are maternally inherited. On the other hand, when identification of individuals is important, as in human forensics, mitochondrial heteroplasmy may need to be taken in account, at least on the negative side when apparent mismatches are found. The authors conclude by suggesting “caution in excluding identity on the basis of a single or small number of mismatched alleles when the tissue in evidence (such as sperm) is not the same as the reference tissue of the suspect (such as blood or hair).” Looking ahead, for those interested in exploring mitochondrial heteroplasmy in other species, the initiative has created a large database of intra-specific variation in diverse species, an essential benchmark for investigating possible within-individual variation.

Note added 22 march 2010: As a thought experiment we can ask: how much of the within-species variability in COI might be due to unrecognized mitochondrial heteroplasmy?  In the present study, the average number of heteroplasmic variant sites in one tissue sample was about 5, and, on average, 33% of such sites were in protein- or RNA-coding regions, which represent about 90% of mitochondrial genome. That gives (5 x .33) sites distributed across (16,569 x 0.90) nucleotides in the mitochondrial genome, which works out to about 0.0001 variants per site. For 650 bp COI barcode region, that corresponds to an average of 0.07 heteroplasmic sites per barcode sequence, or 0.01% variation. So for humans at least, mitochondrial heteroplasmy appears unlikely to contribute significantly to the observed intra-specific variation in COI.

Next-generation DNA barcode application

DNA barcoding efficiently identifies species from flies to fish to flowers, including from bits and pieces and other unrecognizable forms: eggs, larvae, seeds, pollen, roots, damaged museum specimens, and even DNA shed into aquatic and terrestrial environments. What else can we do with this new instrument? With the BOLD reference library at >800,000 records from > 68,000 species, DNA barcoding combined with high-throughput sequencing can be a macroscope for studying large-scale patterns in biodiversity.

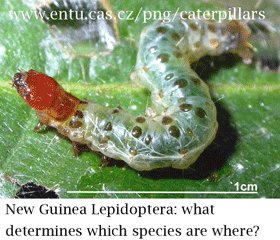
glyophodes-margaritaria1In March 2, 2010 Proc Natl Acad Sci USA researchers from University of Minnesota, National Museum of Natural History, University of Guelph, and University of South Bohemia, Czech Republic, apply DNA barcoding to measure species diversity and distribution in tropical moths and butterflies. In an earlier study (Novotny et al Nature 2007), some of the same researchers had shown surprisingly low beta diversity and little host specialization in herbivorous insects across 75,000 square kilometers in lowland rainforest in Papua New Guinea, an area 1 1/2 times as large as Costa Rica. (Note: alpha diversity is number of species at a given site; beta diversity refers to differences in species composition among sites).

For the Nature report, the researchers hand-collected 74,184 caterpillars representing 370 species; each caterpillar was tested for food preference in the field, and 25,346 were raised to adults. In the PNAS study, the researchers analyzed COI barcodes of 1,359 individuals representing 28 apparently widespread Lepidoptera species for which they had collected large numbers of individuals at 8 sites across the region (average individuals per species, 49, range 29-80; average sites per species, 6.1, range 3-8; average distance between sites, 160 km, range 59 -513 km).

Craft and colleagues found “no universal pattern of population genetic structure among 28 Lepidoptera species in lowland New Guinea.” Although about half of the species showed genetic diversity associated with host plant specialization and/or geographic isolation (some of the variant lineages may represent distinct species), the phylogeographic patterns differed among species and there were a surprising number of widely sympatric species with overlapping diets, a challenge for ecological theory. As the authors note, their results contradict estimates of insect diversity and host specialization in the Americas, and they call for “comparative population genetics of ecological guilds” to enable testing “major hypotheses for the origin and maintenance of species diversity.” Like a new telescope for astronomy, DNA barcoding offers biologists a new instrument for exploring the structure of biodiversity.

The City Ant and The Country Ant: DNA tells the story

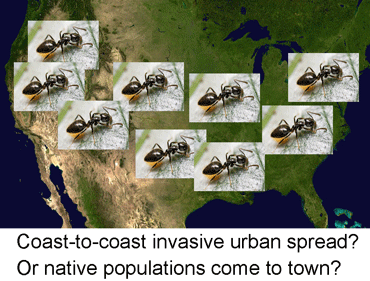
North_America_satellite-tsessileDNA helps answer the origin of infectious diseases: are cases sporadic events or part of larger epidemic, such as the recent Salmonella Montevideo outbreak involving at least 245 persons in 44 states, traced to a single importer of crushed red pepper used in salami manufacturing. In a similar way, DNA helps answer the origin of apparently widespread species–are they part of single outbreak so to speak, or are they multiple independent populations or species. (This suggests useful connections between phylogeography, the genetic study of populations, and molecular epidemiology of disease.)  As with pathogen diagnostics, a minimalist DNA testing approach will help make feasible analyzing large numbers of specimens.

In February 2010 PLoS ONE, six researchers from University of North Carolina report on Odorous house ant Tapinoma sessile (smells like rotten coconuts when crushed), collected from 47 urban and rural localities across the US.  According to the authors, T. sessile is the most common and widely distributed ant in North America, found “from the West coast to the East coast and the deserts nearly all the way to the tundra.” The structure of the 18 colonies examined in detail ranged from a monogynous (single queen) colony in an acorn with 50 workers, to a polygynous colony with 2 queens and 250 workers, to a large, dispersed colony of “several million workers and thousands of queens in and around several buildings on a college campus.”  For DNA analysis, 68 individual were analyzed (1 from each of the 18 colonies, plus 23 collections in natural environments made by entomologists, 26 collections in urban environments mostly provided by pest control professionals, and 1 T. erraticum specimen). Menke and colleagues found 4 distinct genetic groups, corresponding to geographic areas, with 7.5 – 10% COI sequence differences among groups, and relatively small (0.2 – 2.3%) differences within groups, a pattern that “may represent multiple species.” Counter to initial expectations, urban ants were genetically similar or identical to non-urban ants within each region, and colony structure was not associated with urban vs natural environment, namely monogynous and polygynous colonies were found in both environments.

I conclude there is much we don’t know about the commonest, most everyday species, and that DNA barcodes are just the right size for many of the relevant scientific and practical questions. In closing, for a view of complexity of ant life, please see E.O. Wilson’s wonderful short story “Trailhead”, in March 6, 2010, New Yorker, an excerpt from his upcoming book Anthill.

International barcoders get into print

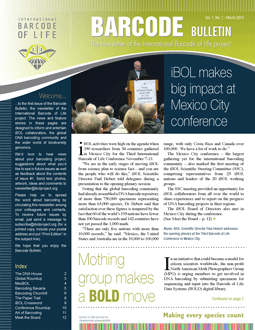
iBOLlogoNow that 3rd International Barcode of Life Conference (held in November 2009 in Mexico City with over 350 researchers from 54 countries) is behind us, where to turn for DNA barcode science and organizational news? A bright answer arrived in today’s email: the first issue of the International Barcode of Life (iBOL) Bulletin (download pdf or view online flash version). The 12-page illustrated quarterly iBOL newsletter has a promising diversity of news. To take one example, I learned that some members of the North American Moth Photographers Group (MPG) are submitting their hard-to-identify specimens to Biodiversity Institute of Ontario, thus building up the reference library, and in turn receiving DNA-based identifications! This sort of crowd-sourcing approach to specimen collection could be a big thing for barcoding in particular, and for biodiversity science in general. There are many dedicated, expert, non-professionals who are likely to contribute given the right framework.

iBOL-Barcode-Bulletin1In terms of citizen participation, the MPG story suggests expanding opportunities for biological research that harnesses the skill and energy of non-professionals, a step beyond the successful BioBlitz model, which still requires a lot of on-site organization. If North American birders can create a comprehensive, regularly-updated database documenting migration, i.e. eBird (1 1/2 to 2 million sightings submitted monthly), then there must be a large potential for crowd-sourcing specimen collection, at least for certain organisms. After all, the most expensive part of biodiversity science is often collecting and/or documenting specimens. How to encourage and streamline data collection is suggested by Cornell University’s recently-released iPhone app BirdsEye, which displays current local sightings based on eBird database and user’s GPS location, with planned update that will enable birders to instantly update eBird with their own sightings.
The Barcode Bulletin aims to “inform and entertain iBOL collaborators, the global DNA barcoding community and the wider world of biodiversity genomics”; this issue is a promising start.

Medicinal orchids unmasked

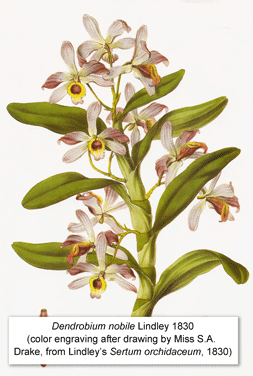
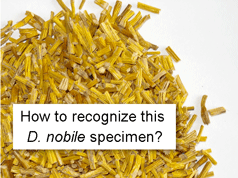
Herbal products make a compelling case for DNA-based identification–how else to recognize dried bits of roots, leaves, stems, bark, and flowers from a multitude of species? In December 2009 J Nat Med, researchers from Ochanomizu University and Showa Pharmaceutical University, Japan, apply recently agreed-upon standards for DNA barcoding land plants, namely matK and rbcL, to distinguish among Dendrobium species. Dendrobium is a large (about 1200 species) genus of orchids widely distributed through east Asia to Philippines, Australia, and New Zealand.  Over 50 Dendrobium species are used in traditional medicines and are thought to have various pharmacologic activities, although the active ingredient(s) are not yet characterized.
Asahina and colleagues analyzed rbcL and matK from 12 samples representing 5 Dendrobium sp. and 3 hybrid cultivars whose genetic histories are uncertain. Single primer sets successfully amplified matK and rbcL from all specimens. The researchers cloned PCR products (and then sequenced at least 3 clones per species), rather than directly sequencing amplified products (rationale for the cloning step is not given). They found that matK, but not rbcL, distinguished among the five species; this is consistent with general observation that rbcL varies less among closely-related species than does matK. Results were similar when 22 matK Dendrobium sp. sequences from GenBank were added to analysis (bringing species total to 6), with one exception; 1 of 11 D. officinale GenBank matK sequences was unique, and in NJ diagram appeared on branch distant from the other 10. In this modest sampling, there was no intra-specific variation in the original 12 samples; some intra-specific differences were noted in 2 species in comparison with GenBank sequences.

Untitled-7This study demonstrates advantages of DNA barcoding approach for plant identification. Of course, there is already a lot of interest in DNA identification of herbal plants in general and Dendrobium orchids in particular. For example, I found over a dozen articles describing DNA methods for distinguishing Dendrobium sp. However, the methods described are limited to identifying species in this one genus, which means one has to have a pretty good idea what the specimen is before applying DNA testing! This highlights the essential advantage of barcoding–a standardized approach can be applied to any unknown, and makes feasible creation of a comprehensive reference library.

Looking ahead, we want to know more about intra- and inter-specific variation in plants. In animals, the patterning of mitochondrial variation is quite uniform, with intra-specific << inter-specific variation, such that most species form relatively tight clusters distinct from those of other species in NJ diagrams. Results so far in plants generally show little intraspecific variation in chloroplast genes (including rbcL and matK), but a diversity of distances among closely-related species. Assuming these early results are borne out, we then want to know why plants and animals differ? For more genetic variation in plants and animals, see Rieseberg et al Nature 2006, Fazekas et al Mol Ecol Res 2009).

Identifying forensic flies with DNA

800px-Sarcophaga_nodosaIn forensic investigation, insect evidence helps date the time of death, as the various species that colonize corpses exhibit different stages of development according to time and temperature. Determining the post-mortem interval (PMI) rests on accurate species identification, including of immature forms. In Dec 2009 Int J Legal Med researchers from University of Wollongong, Australia, test DNA-based identification of Sarcophagidae flies, which lack distinguishing features as immature forms, and their adult identification requires “meticulous examination of subtle morphological differences, including regional hair presence and colour, body pigmentation and bristle length, placement and abundance”, and even then may need genitalic dissection for confirmation. As a result, sarcophagid flies are little used in forensic study, although being viviparous, they are “prospectively more reliable for PMI estimations compared with other initial dipteran colonisers” [the latter are mostly egg-laying species (e.g. callophorid blowflies), which hatch only if certain environmental conditions are met, adding uncertainty to PMI determinations].

The researchers successfully recovered COI barcodes, without evidence of pseudogenes, from 85 adult specimens representing 16 species, using a single primer pair with degenerate bases previously applied to forensic blowflies (Nelson et al 2007 Med Vet Entomol).  In NJ analysis, 14 of 16 species showed single clusters distinct from other species; the remaining 2 species showed deep divergences which the authors surmise may indicate cryptic species, perhaps more likely given that “taxonomic descriptions of the Australian Sarcophagidae have not been updated since the 1950s”.

Meikeljohn and colleagues demonstrate efficacy of COI barcodes as species-level identifiers for Australian sarcophagids. The tight intra-specific clustering in these flies appears identical to that seen in diverse animal groups including vertebrates, for example, yet flies are presumably several orders of magnitude more abundant. (As an aside, although the authors report their sequences and associated specimen data are deposited in BOLD, their data are not visible in “Public Projects”–I hope the authors will amend this.)  What then limits mitochondrial variation within species? Or in the language of population genetics, why are effective population sizes for animal species uniformly small, unrelated to census population sizes? Like the nature of dark matter, explanation(s) await.

Addendum 11 Feb 2010: Dr. Meikeljohn reports that the sequences and associated data are scheduled to appear in BOLD and NCBI GenBank as soon article appears in print edition.

Trans-Atlantic DNA survey reveals overlooked avian diversity in scientific heartland

UntitledIn January 2010 J Ornithol (open access article) researchers from Norway Natural History Museum, Swedish Museum of Natural History, University of Guelph, and Rockefeller University (myself) survey mitochondrial differences in 296 species representing 97-98% of Scandanavian breeding birds. 283 (95.6%) of species formed unique clusters; the remaining 13 species formed 5 clusters consisting of 2-4 species with shared or overlapping barcodes, which might reflect young species, hybridization with introgression, and/or a single gene pool. Surprisingly for such a relatively small geographic area, large sequence differences were found in 4 species, all of which have large breeding ranges that extend outside of Scandanavia; the authors propose these represent “a mixture of separate lineages that evolved in allopatry” and advise further sampling to “elucidate the phylogeographic history”.

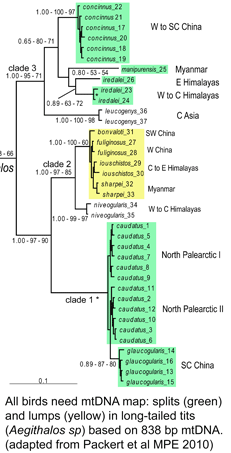
Johnsen et al take advantage of existing barcode library to compare species whose breeding ranges extend across the Atlantic. 19 (25%) of the 78 showed intercontinental divergences typical of species-level differences, including 8 species that had not been identified in prior work (data re-compiled in figure below). Most were inland species with discontinuous breeding ranges but there were unexpected exceptions such as Steller’s eider (Polysticta stelleri), which has what appears to be a continuous circumpolar breeding range. Three of the species formed paraphyletic clusters when combined with N American congeners, suggesting the inter-continental “conspecifics” are not even each other’s closest relatives.

Untitled6aIn my view, this paper demonstrates that a survey approach produces a high level of discovery and hypothesis-generating, and leads me to question how well we understand diversity in birds, which are generally considered the taxonomically best-known large group of animals. Many of the species in the present study have been known to science for over 250 years, are resident in densely-settled, scientifically-advanced regions, and yet Johnsen and colleagues demonstrate hidden diversity. In 1946, Ernst Mayr compiled a world list of 8,616 species, which he judged to be “within 5 percent and certainly 10% of the final total”. The current IOC World Bird List v 2.3 recognizes 10,322 species (19% higher than Mayr’s estimate) and there is a steady stream of splits of existing forms, fueled by DNA sequence data. I believe DNA barcoding offers a way complete this process in a timely manner. If we analyzed multiple individuals from each of world’s named species, there would still be many areas of uncertainty, but at least the larger differences would be known. It is a scientific embarrassment that we are still discovering lineages that have been reproductively isolated for millions of years, in everyday birds no less!

There are over 300,000 avian tissue samples in the world’s museums, representing over 7,000 species (Stoeckle and Winker, Auk 2009). By my calculation, a modest number of these have been analyzed to date for species-level differences. For instance, by my count GenBank contains 13,361 cytochrome b sequences representing 4,320 avian species, and the All Birds Barcoding Initiative (ABBI) has so far collected 17,250 sequences representing 2,969 species. A concerted project of the world’s avian tissue collections employing DNA barcoding approach suggests an unmatched opportunity for large-scale, species-level genetics with many discoveries and hypothesis-generating findings which will inform various areas in evolutionary science. For instance, population genetics modeling starts with correctly identifying breeding populations (ie species). These samples may be eventually be analyzed in small batches, assuming they are not lost or destroyed, but the pace of standard research practices brings to mind the story of the Dead Sea Scrolls. Some were published soon after discovery in 1946, but the rest fell under the control of a committee of scholars and remained hidden not only from public but from other scholars for more than 40 years. When the monopoly was broken in 1991 (by researchers using a desktop computer to reconstruct texts from published concordances), some complained:

“Dr. Frank M. Cross, a scholar at the Harvard Divinity School who has worked with the scrolls since the 1950’s, said in a telephone interview that the publication of these unauthorized versions, which he described as “pirated,” would have no effect on the pace and publication schedules involving the actual scrolls. He defended his colleagues from the frequent charges of undue secrecy and procrastination, saying the critics did not understand the difficulties of working with the remaining unpublished documents that are mostly a collection of fragile fragments of parchment.” New York Times September 5, 1991

Names

In Systema Natura 250 (Andrew Polaszek, ed; CRC Press), a new collection of essays on the state of taxonomy, David Schindel and Scott Miller address how to speed up “naming” of specimens without causing chaos, in chapter entitled “Provisional nomenclature: The on-ramp to taxonomic names.” The authors observe the increasing numbers of undescribed and undescribable specimens (eg fragments, mixed environmental samples) and propose to standardize provisional names (preferred designation of these standardized hu7temporary placeholders is “taxon label”). As they note, there are many provisional names in GenBank (e.g. Ocyptamus sp. MZH S143_2004), so this is not a change in usual practice, except that the format of provisional names is standardized. As a starting point, Schindel and Miller propose a scheme developed by Council of the Heads of Australian Herbariums (CHAH) and recommend review by Biodiversity Information Standards (TDWG). The CHAH format is:

Genus_name sp. Locality (Voucher identifier) Source, where “(Voucher-specimen identifier) is a two-part field consisting of a collector’s name and the voucher specimen number attached to the exemplar of the taxon concept,” and “Source refers to the name of the concept’s proposer.”  Regarding sequence data as identifiers, such labels could be generated by a clustering algorithm for DNA barcodes for example. Schindel and Miller discuss short and long-term advantages to taxonomic workflow, academic credit, and scientific sharing.

A standardized format for provisional names is a simple, powerful proposal with many downstream benefits. I hope TDWG will adopt!