Knowing the unknowable

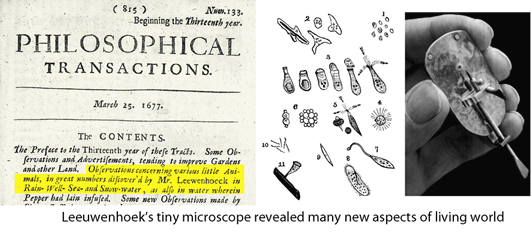
350 years ago Anthony van Leeuwenhoek explored the living world around (and within!) him using tiny, powerful, single lens microscopes. He discovered “tiny animacules” including what we now know as protozoa and bacteria, and detailed structures of plant and animal tissues.  In a similar way, DNA study can reveal features of the living world that would otherwise remain unknown.

In July 2010 Deep-Sea Research (not open access) investigators from National Institute of Water and Atmospheric Research, New Zealand, report on what deepwater sharks eat. Dunn and colleagues analyzed stomach contents of 194 sharks from 6 species (14-50 individuals per species) collected in bottom trawls on the Chatham Rise, a relatively shallow area and important fishing ground that extends 1000 km east of New Zealand, at depths of 200-800 m (note: at these depths ocean is nearly dark and does not support photosynthesis). FYI, the sharks studied are Kitefin shark (Dalatias licha), Deepwater spiny dogfish (Centrophorus squamosus), Roughskin dogfish (Centroscymnus owstonii), Deepwater dogfish (Centroselachus crepidater), Lord Plunket’s shark (Proscymnodon plunketi), and Eastern school shark (Galeorhinus galeus).

Perhaps related to the trawl capture method, the individual sharks were relatively small, ranging from 0.38 – 1.6 m depending on species. Prey items were first subject to morphologic identification, and DNA barcoding (using standard primers for full-length 650 bp COI barcode) was performed only if items were visually unrecognizable. Of the 118 sharks with non-empty stomachs, 43 (36%) had prey identified by morphology alone, 28 (24%) by DNA alone, 37 (31%) by both, and in 10 (8%) no items were identifiable by either method. In addition to a variety of fish, predominantly Hoki (Macruronus novaezelandiae) , the most abundant and commercially most important fish on the Chatham Rise, prey items included other shark species, shrimp, octopus, and squids.

In this report, Dunn and colleagues describe what sharks living in near-darkness in the deep ocean eat. Absent DNA, most of this information would be unknowable. The authors conclude that “DNA barcoding can be used to identify prey, and can greatly increase the rate of data accumulation,” noting “the current cost of survey time vastly outweights that of DNA barcoding of prey, making DNA barcoding a cost-effective way of increasing sampling rate”.

Naming names faster (addendum)

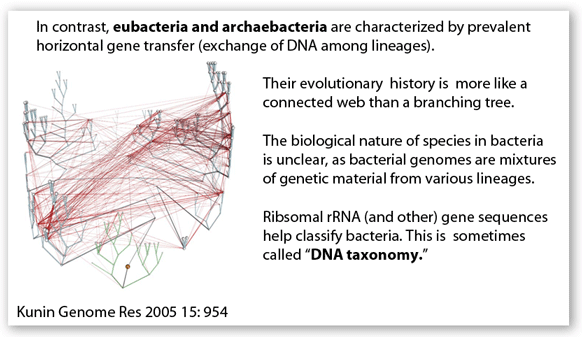
In yesterday’s post I placed “integrative taxonomy” on a spectrum with morphologic taxonomy at one end and “DNA taxonomy” as applied to eubacteria/archaebacteria at the other. Mehrdad Hajibabaei pointed out that bacterial diversity is not partitioned into species in the same way it is in animals and plants. Eubacteria/archaebacteria have relatively fluid genomes with frequent exchange of DNA among lineages. Fewer than 10,000 bacterial species have been named, although their diversity is certainly vaster than all eukaryotes (2 million named species).  Thus DNA-based classification of bacteria, at least as presently applied, does not meet the goals of DNA barcoding, which aims to capture species-level differences.

Naming names faster

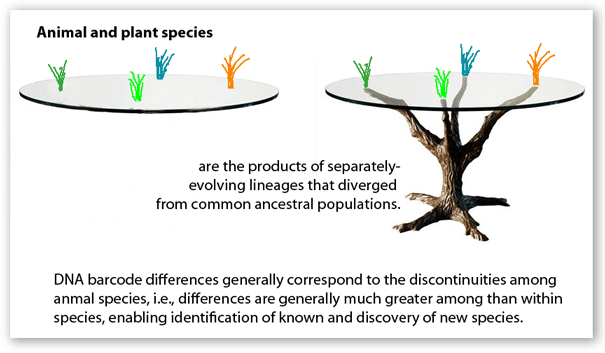
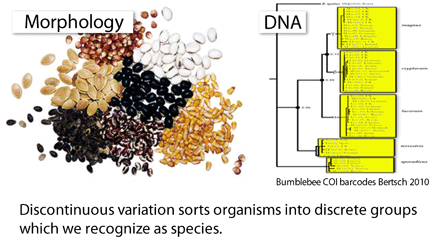
Species are the units of biodiversity. Discontinuities in biological variation sort organisms into discrete groups that we recognize as species, and so gathering data on differences among organisms is the necessary first step in understanding the diversity of life. Here DNA has singular value–all organisms have DNA and some genetic loci are widely-shared, enabling direct comparisons across the  diversity of multicellular life. Barcoding targets widely-shared gene sequence(s) that nonetheless differ among most closely-related species (COI for animals and rbcL+matK for land plants), providing broadly applicable metrics for mapping the discontinuities that represent species. Large-scale DNA barcoding thus offers for the first time a macroscopic view of biodiversity.

This sounds straightforward enough, but naming species, like medical diagnosis, is a process requiring human judgment. A taxonomic expert generally focuses on one or a few species or potential species at a time, sifting through morphological, ecological, behavioral, and DNA data and making inferences about the evolutionary past. It generally takes years or decades between specimen collection and publication of a new species description, and my impression is that most specimens in museum collections including frozen tissues have never been scrutinized in detail sufficient to determine whether they represent new species. Given that a high-throughput laboratory can generate a hundred thousand barcodes in a year, there are opportunities for new workflows.

In May 2010 Frontiers Zool, researchers from Uppsala University, Sweden, and Technical University of Braunschweig, Germany, look at how we might incorporate the flood of DNA data, outlining an approach they (and others) call “integrative taxonomy”. As current practice in taxonomy already involves integrating different kinds of data (morphology, behavior, range, DNA), I take this term to mean an approach somewhere between one primarily based on morphology (“traditional taxonomy”) and one primarily based on DNA (“DNA taxonomy”), such as that for eubacteria and archaebacteria. Padial and colleagues review the recently revitalized scientific discussion about species delimitation involving population biology and phylogenetics, noting “what matters for the study of speciation matters for taxonomy as well.” They call for a flexible approach including the possibility of “recognition of a species on the basis of a single set of characters”, which could be DNA barcodes.  Near the end, they address the big challenge, which is that DNA studies, particularly DNA barcoding, “are revealing units that might represent potential new species at a faster pace than results can be followed up for taxonomists.” Padial and co-authors review various protocols used for naming “candidate species” and conclude “standardization of such schemes across taxonomic groups of eukaryotes would be clear progress for data retrieval systems.”  As described in more detail here previously, a starting point for discussion of the preferred format for standardizing provisional names was recently proposed (Schindel and Miller, System Naturae 250, Chapter 10), based on the scheme currently used by CHAH (Council of Heads of Australian Hebaria). This system of “taxon labels” (as distinguished from “taxon names”) meets the criteria of uniqueness, stability, and non-confusion with formal taxon names.

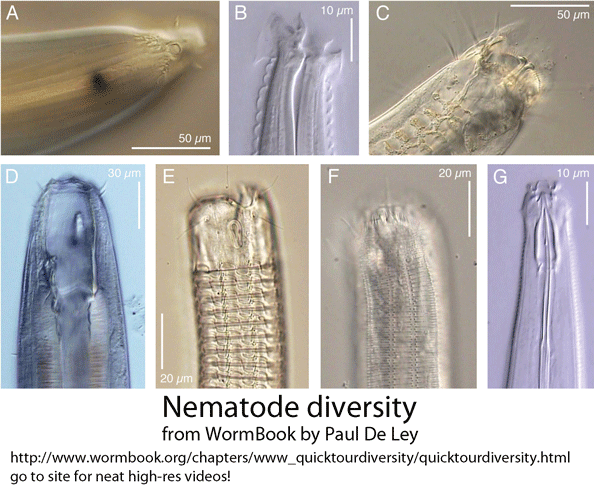
At present, our knowledge of biodiversity is built around a catalog of taxon names, annotated with DNA data if available. I imagine the future catalog as being a DNA (barcode) map, annotated with taxon names if available. Some parts of the map, such as for birds, will be heavily annotated, and others, such as for nematodes, will have few formal names, and instead will have taxon labels generated by automated clustering algorithms. In some cases, the DNA data will be derived from individual specimens, backed up by museum vouchers, and in other cases it will be generated from environmental sampling. Only then will we begin to see how much biodiversity is unexplored.

New scientific newsstand for marine barcoders

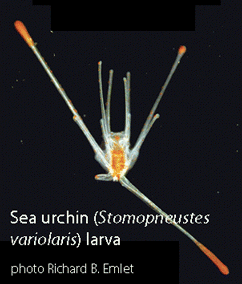
Identifying marine life is a major challenge. On land, nearly all animals visible without a microscope are in one of two phyla: Chordata or Arthropoda, the latter most often represented by insects.  In contrast, many ancient lineages are present in the oceans. Abundant marine phyla with well-known representatives include Mollusca (molluscs), Porifera (sponges), Cnidaria (corals, jellyfish), Ctenophora (comb jellies), Echinodermata (sea urchins, others), as well as Chordata (e.g. fish) and Arthropoda (e.g. crabs). Many marine species have strange immature forms (see sea urchin larva above), which may puzzle specialists and others. Even marine vertebrates can be challenging. Using mitochondrial DNA, researchers recently discovered that what were thought to be three families of deep-sea fishes were in fact larval, male, and female forms of a single family of fish (Johnson Biol Lett 2009). Observation of marine life is difficult except in a few near shore areas. It is easier for a school child with a pair of binoculars to survey the moon than for a team of oceanographers with expensive equipment to study the deep ocean.

As with the enigmatic fish species described above, routine application of DNA-based identification will advance oceanographic science, and I imagine will have an even more transformative impact than in terrestrial research. To help establish the DNA reference library, we have the Marine Barcode of Life Initiative (MarBOL), a joint effort of Census of Marine Life (CoML) and Consortium for the Barcode of Life (CBOL), which aims to “enhance our capacity to identify marine life” through DNA barcoding. I note that PLoS ONE recently set up “The MarBOL Collection” of papers devoted to marine barcoding and look forward to seeing how this scientific “newsstand” develops. In June, PLoS ONE received an impact rating of 4.351, placing it in the top 25% percentile of biology journals, making it a prominent place for highlighting and disseminating scientific developments.

Commercial opportunities

The most successful technologies generate money. In turn, a commercial market helps drive improvements in cost and speed, enabling wider applications and new scientific knowledge. The rapid completion of the Human Genome Project (HGP) can be seen as a direct result of Applied Biosystems ABI 3700 DNA analyzer, the first fully automated capillary sequencer, introduced in 1998. In turn, the large market for high-throughput sequencing that resulted from HGP funding helped drive multiple rounds of improvement in cost and speed.

This leads me to thoughts about DNA barcoding.  The first exploratory meetings were held in 2003 at Banbury Center, Cold Spring Harbor Laboratory. Seven years later DNA barcoding is established as an accurate method for species identification with diverse scientific applications. BOLD, the publicly-available library of DNA barcodes, contains over 800,000 records from over 70,000 species. A new international effort, iBOL, is underway to establish DNA barcode libraries for 5 million specimens from 500,000 species by 2015. Like the government-maintained network of GPS satellites, publicly-funded DNA barcode libraries appear to offer enormous commercial opportunity, with potential benefits to society and science.

Where is barcoding on this path? So far, I find only a handful of companies and/or products that provide DNA-based species identification  (for example, Therion, SteriSense, FishDNAID, Applied Food Technologies, Ecogenics).  Of the few that exist, most are aimed at fish identification and do not take advantage of large scope and transparent sourcing of DNA barcode libraries. For example, Agilent Technologies recently introduced a “Fish identification system” based on “experimentally-derived [PCR-RFLP] patterns from more than 50 species.” This is wonderful but the scope is too small and the underlying library is unknown. Agilent is participating with the National Center for Food Safety and Technology,  a US government-industry collaboration, so perhaps that will lead to more robust applications. I note that DNA barcode detection of food fraud (not just fish) was front-page news in Washington Post in March 2010 and the potential educational market is also large. I look forward to more entrepreneurs, whether at established companies or start-ups!

Recognizing invasive insects threatening forests

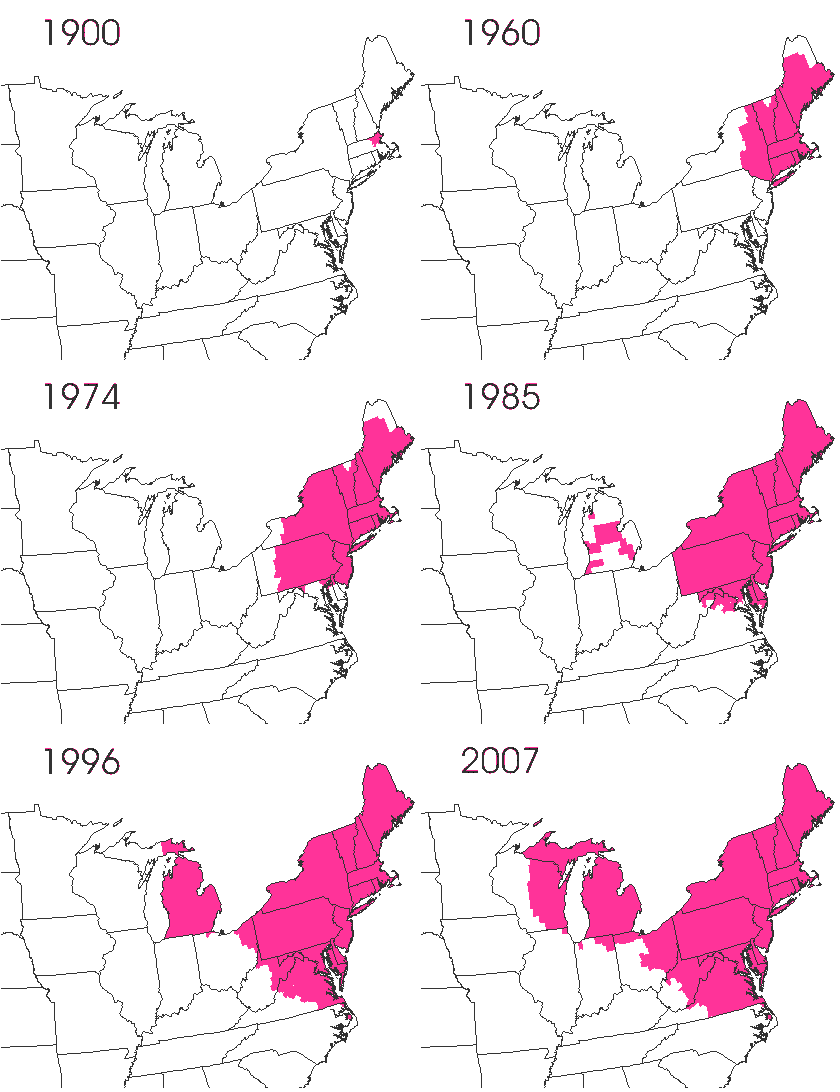
Gypsy_moth_spread_1900-2007In the late 1860’s, a French entomologist, Étienne Léopold Trouvelot, living in Medford, Massachusetts, imported gypsy moths (Lymantria dispar) which he hoped to hybridize with domesticated Asian silkworms (Bombyx mori), thereby creating a new silk-producing strain with improved disease resistance (for history, see US Forest Service page). The experiment failed (not surprising given moths are from different families), the colony escaped from Trouvelot’s backyard, and gypsy moths became established as a major pest of hardwoods in the northeastern US (animated range data from US Forest Service at right). Subsequent introductions of numerous forest pests and pathogens into the US, largely through importation of infested wood products, have had large impacts on timber industry and local ecosystems alike, and have led to near extinction of American chestnut, and large-scale mortality in elm, hemlock, and oak, and other tree species.
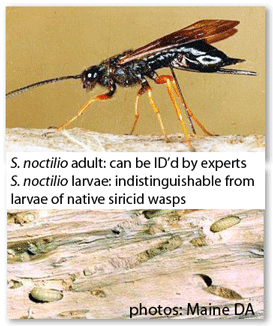
SN_damage22The first step in controlling invasive species is detection. In J Entomolog 2010 7:60 researchers from USDA Forest Service report on DNA barcode identification of Eurasian woodwasp Sirex noctilio. S. noctilio has been established and spreading in northeastern US and Canada since at least 2004, and “will likely become a major pest of pines and possibly other conifers in North America.” The wasp attacks living pines, laying eggs along with an inoculum of  “phytotoxic mucus” and an exotic [non-native] wood decay fungus (Amylosterum areolatum). The wasp larvae “feed on pine wood decayed by the fungus and on the fungus itself”, weakening or killing the tree.
Wilson  and Schiff analyzed COI barcodes of 207 larvae or adults representing 27 woodwasp species or subspecies (including 6 Sirex spp.) following a fairly standard protocol (i.e., 1 leg, DNAeasy kit, HCO 2198/LCO 1490 primers.) [As an aside, these primers (Folmer 1994) remain surprisingly widely used for barcoding invertebrates, despite development of several other effective broad-range primers for COI barcode region (e.g., see CCDB collected protocols), which perhaps reflects absence of a large-scale direct comparison.] All species gave distinct barcodes, minimum interspecific distance was 7.6 (maximum  26.2%) , and, remarkably, there was no variation within any named taxa (average 9 individuals per species/subspecies, range 4-23). However they observed 2.3%-2.8% differences between subspecies of Xeris spectrum and Sirex juvencus, suggesting that “taxonomic revisions are probably in order to separate these subspecies in each case into separate subspecies.”

In addition to application in forest surveys, Wilson and Schiff note the need for a “standardized diagnostic method of identifying insect larval stages at ports of entry within imported wood producs…and in wood used as crates and dunnage for imported goods.” For example, “recent analyses of Sirex larvae intercepted from 1985-2000 by USDA-APHIS personnel at US ports of entry…indicate that only 7 (6.8%) of 103 specimens could be identified to species (Hoebeke et al 2005).” The authors conclude “DNA barcode methods can be used to identify larval states of woodwasps…as easily as free-flying adults,” which “should help prevent future introductions of S. noctilio and other exotic woodwasps.”

Avian catalogue still incomplete

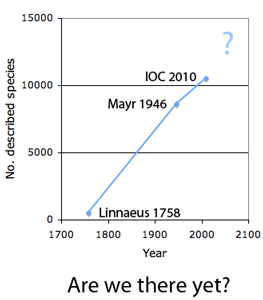
world-bird-species2How many birds in the world? In the tenth edition of Systema Naturae (1758) (copy in US Library of Congress can be viewed or downloaded here, thanks to Biodiversity Heritage Library), Linnaeus listed 564 species collected from all over the world. In 1935, Ernst Mayr estimated 8,500 world birds, and counted more precisely in 1946, arriving at a total of 8,616 species (Auk 63:64-67). Mayr judged “this figure is probably within five per cent, and certainly within ten per cent, of the final figure” and predicted “whatever changes may occur in the future will be due primarily to taxonomic revaluations, that is to shifts from specific to subspecies status and vice versa.” As of today, the IOC World Bird List v2.4 names 10,386 species, plus another 139 accepted or proposed splits, altogether about 20% above Mayr’s 50 year-old estimate.
As Mayr predicted, nearly all new birds represent “splits” of existing entities, often elevating described subspecies to species status. Mayr estimated about 28,500 “valid subspecies”–might these represent species? Most splits reflect, at least in part, newly discovered genetic differences in mtDNA. In 2004, Robert Zink examined in detail 41 widely-distributed N American birds, and found an average of 1.9 “historically significant units” per species, i.e., distinct mtDNA clusters, most or all of which likely represent distinct species (Proc R Soc Lond B 271:561). At the same time, he found over 90% of subspecies “lack the population genetic structure indicative of a distinct evolutionary unit.” I conclude that species-level avian taxonomy will benefit from a concerted effort to analyze mtDNA in all world birds, namely, All Birds Barcoding Initiative (ABBI). Large scale DNA barcoding surveys so far have found distinct mtDNA clusters in  4-24% of species (e.g., Kerr et al 2007, Kerr et al 2009, Johnsen et al 2010).

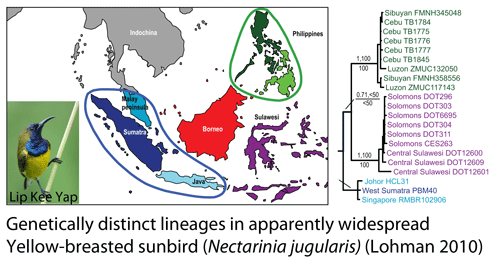
Lohman-2In some regions and categories of birds, the proportion of unrecognized species may be even higher. In August 2010 Biological Conservation researchers from 8 institutions in Southeast Asia and North America report on “cryptic genetic diversity” in non-migratory Philippine birds that are also apparently widespread in other Southeast Asian countries. Lohman and colleagues analyzed seven of the 72 non-migratory, non-endemic Philippine species in detail, represented by 210 tissue specimens (9-51 specimens/species), collected from 16 countries over 18 years by 54 collectors and held in 13 institutions!

mtDNA analysis revealed genetically distinct clusters in all seven species (minimum Philippine/non-Philippine genetic distance 0.9-8.8% in COI, 2.1-9.4% in cytb). The researchers observe that using a “combination of monophyly, morphological distinctiveness as recognized by current subspecific taxonomy, and a 3% COI distance as a threshold for highlighting possible unrecognized species, six putatively new endemic Philippine species are revealed.” In addition to distinctness of Philippine forms, six of the seven species showed multiple (3-7) geographically-restricted lineages in Southeast Asia, at least some of which are likely to represent new species as well.

As Lohman and colleagues demonstrate, many of the tissue specimens needed to complete the census of world birds are already in museums, awaiting analysis. The world’s avian tissue collections comprise over 300,000 specimens representing over 7,000 species (Stoeckle and Winker Auk 2009), most of which, I surmise, have not been analyzed for any gene. DNA barcoding of existing avian tissue collections will likely lead to many discoveries.

Evidence

What is the evidence that DNA barcoding is a reliable method for species identification?

For this commentary, “DNA barcoding” refers to nucleotide sequencing of PCR-amplified DNA corresponding to an approved barcode region, namely 5′ portion of COI for animals or rbcL + matK for land plants; and “species identification” refers to assigning the name of a known species to a specimen of unknown identity.

Acceptance by scientific community. For identification of known species, I think it is fair to say that DNA testing in general and DNA barcoding in particular are generally accepted in the scientific community as reliable methods. For example, the Canadian Centre for DNA Barcoding website has a compilation of peer-reviewed publications, which includes over 500 articles published since 2003.  The primary limitation to identification is whether the relevant species and close relatives have yet been documented in the databases at the time they are queried. The BOLD database is strongest for multicellular animals (> 1,000,000 records as of May 2010; see chart), particularly arthropods and chordates. For plants, the general principles are the same, but so far there is much less documentation, as plant barcodes were not agreed-upon until last year (Hollingsworth et al PNAS May 2009), and there was not a large set of pre-existing data to Untitled-2-records-2work with. Nonetheless, DNA barcoding of plants is ready for practical application and is providing immediately useful information (e.g. “DNA barcoding exposes a case of mistaken identity in the fern horticultural trade” Prior et al, Mol Ecol Resources April 2010) . For fungi, from perusing database it appears that ITS (internal transcribed spacer) and COI are informally accepted as barcodes. For protists and other domains of life, results so far suggest COI will serve as a primary barcode.

Most articles focus on DNA barcoding in a particular group and assess the accuracy of identification in that group. For example, in “DNA barcoding of commercially important salmon and trout species (Oncorhynchus and Salmo) from North America” (J Agricultural Food Chem 57:8379, 2009) Rasmussen and colleagues analyzed more than 1000 samples representing the 7 commercially important salmonid species from 143 sites  across western North America including Alaska and Canada, (to capture possible variation within species) The authors found 100% separation of these species by DNA barcoding, i.e., distances among species were always greater than within species.

Forensic application. DNA barcoding for species identification has been used in legal cases (e.g. Cohen et al J Food Protection 72: 810, 2009). More general evidence is presented by Dawnay et al in “Validation of the barcoding gene COI for use in forensic genetic species identification” (Forensic Sci International 173:1, 2007). The authors conclude “this study demonstrates that the cytochrome c oxidase I gene enables accurate animal species identification where adequate reference sequence data exists.” As with any laboratory method, quality control and quality assurance (QA/QC) measures are essential (e.g. Morin et al J Heredity 101:1, 2010).

DNA barcode identification was designed to be a simple, straightforward method appropriate for wide use, and the results so far amply bear this out, including its use by high school students (e.g., “FDA pressured to combat rising ‘food fraud’,” Lyndsey Layton, Washington Post March 30, 2010). One aspect that needs work in my opinion are better explanations of the algorithms used for matching sequences to the databases and what the results mean. It still takes an expert to make sense of the data. Although the results are often obvious (e.g., 100% sequence identity to 10 barcode records of “Bos taurus (cow)”, interpretation is context dependent–a 100% match has a different meaning if a “neighboring” species differs by, say 1%, or if a congeneric species is not documented or is represented by a single record, for example. In my experience, identifications are usually straightforward, including recognizing ambiguous identifications. Nonetheless, for DNA barcoding to have the widest use, including in legal settings, it will be helpful to have better documentation of how we arrive at species diagnoses through DNA barcodes.

Why we need DNA ID

a) Culex pipiens, b) Culicens incidens, c) C. pipiens larvae, d) C. pipiens eggsBiting insects transmit human and animal diseases, including protozoan (e.g., malaria, leishmania, trypanosoma (sleeping sickness, Chagas disease)), filiarial (e.g., onchocerciasis, Guinea worm), and viral (e.g., yellow fever, West Nile, dengue) diseases. Control measures rely on identifying the insects, which generally requires expert training.

There are 174 mosquito species and subspecies in North America (“Identification and Geographical Distribution of the Mosquitos of North America, North of Mexico,” Richard F. Darsie, Jr. and Ronald A. Ward, University Press of Florida, 2005). Many species bite humans, but only a handful are important disease vectors. It takes an expert to identify Culex pipiens (panel A), which is the major vector for West Nile virus in eastern U.S., and to distinguish this from other species, for example, Culiseta incidens (panel B), which does not transmit human disease. Even experts are challenged by larvae (C), and eggs (D), and the latter are small and easily overlooked (egg raft size shown in inset). Planning and/or applying control measures is best done before adults hatch, but the early stages are what is most difficult.

The reference work cited above includes morphologic keys for identification of adult females and fourth-instar larvae. However, only an expert could make use of these (e.g. “lower mesepimeral setae absent, pale basal band on abdominal tergum II narrowed, or completely interrupted, medially). If mosquito identification is important for society, then reference DNA barcodes are what is needed, as these enable many more persons to name specimens, regardless of life stage. It does not make sense to rely on reference works for the world’s mosquitos that are incomprehensible to anyone who is not already a mosquito specialist.

Leishmaniasis: DNA helps ID vectors, parasite, control agent

Leishmaniasis is a chronic parasitic infection caused by various Leishmania species, kinetoplast protozoans related to Trypanosoma (the latter includes agents of African sleeping sickness and Chagas disease, suggested as a cause of Charles Darwin’s ill health in late life).  Depending on the species involved, leishmaniasis manifests as illness ranging from non-healing cutaneous or mouth ulcers (CL) to sometimes fatal visceral infection (VL). In the Neotropics, 12 species infecting humans have been identified, all associated with CL.  Neotropical leishmaniasis is mostly zoonotic  (ie originates from animal reservoirs as opposed to human-to-human transmission), and the vectors are tiny phlebotomine sand flies, particularly Lutzomyia sp.

Lutzomyia_longipalpis-sandflyIn March 2010 PloS Neglected Trop Diseases investigators from Smithsonian Tropical Research Institute (STRI) and Instituto Conmemorativo Gorgas de Estúdios para la Salud, Panamá, apply DNA testing to Lutzomyia sandflies collected on Barro Colorado Island, STRI’s island home in the Panama Canal. Aiming to analyze as many species as possible, Azpurua and colleagues selected 435 individuals, which they morphologically identified as representing 16 Lutzomyia and 2 Brumptomyia sandfly species, for further analysis. Over 95% of specimens in the original collection were from one species, L. panamensis, so this was not a completely representative sample; nonetheless, “the relative abundances of species collected in this study were significantly correlated to those found in a previous intensive study of sand fly community composition on the [Panama] mainland…that collected over 30,000 Lutzomyia individuals in 35 species.”

To skip to the end, COI barcodes unambiguously assigned all 49 individuals to 18 distinct lineages corresponding to named species, plus highlighted 2 genetically-divergent individuals that might represent cryptic species.  Using  primers for ITS-1 (a nuclear gene) and mini-circle DNA (part of mitochondrial genome), Leishmania were detected in 2 of 5 human-biting species, Lu. trapidoi (13/30 individuals tested, 43.3%) and Lu. gomezi (5/19 individuals tested, 26.3%). By my estimate, taking into account relative abundances of Lutzomyia sp., about 1% of Barro Colorado Island sand flies carry Leishmania. Surprisingly, DNA sequencing identified the parasite as Le. naiffi, a South American species not previously reported in Panama. Finally, using the same set of DNA extracts, the researchers tested for Wolbachia, a rickettsial intracellular insect parasite and candidate biological control agent. Wolbachia were found in 3 of 18 species, including 50% of Lu. trapidoi, the main vector of CL in Panama. As an aside, I note that the presence of Wolbachia apparently did not interfere with discriminating among sand fly species; hypothesized interference from Wolbachia was one of the early worries some expressed about DNA barcoding (e.g Whitworth Proc Biol Sci 2007).

Standardized DNA testing enables many more persons to identify insects, regardless of life stage, including those that serve as vectors for human diseases. In this report by Azpurua and colleagues, the discovery of a new species of Leishmania for Panama, and possible undescribed Lutzomyia vectors, suggests that wide application of standardized DNA testing will lead to further discoveries relevant to control of human and animal infectious diseases.