On September 13, 2016 Jesse delivered a lecture on Marine biodiversity revealed by extracellular DNA in seawater as part of the conference celebrating the 70th birthday of Russia’s Shirshov Institute of Oceanology. Thanks to Mark Stoeckle, who leads PHE’s eDNA work.
Area of Research: DNA Barcoding
Barcode Human Evolution
Mark Stoeckle and David Thaler’s (former RU colleague, now at University of Basel) paper on what DNA barcodes reveal about human evolution and vice versa, entitled “Bridging two scholarly islands enriches both: COI DNA barcodes for species identification versus human mitochondrial variation for the study of migrations and pathologies” is published in open access Ecology and Evolution.
Real Food, Fake Food
Mark Stoeckle is interviewed about fish substitution and his daughter Kate’s high school “Sushi-gate” project in an engaging new book “Real Food, Fake Food” by Larry Olmsted. The author also quotes Mark about what he describes as the “poster child” for fish substitution, namely, red snapper, in a Wall Street Journal article.
Mark worked with Lyubov Soboleva, a rising high school senior in the RU Summer Student Research Program (SSRP), on expanding the eDNA reference library for NYC/NJ fish species. Using specimens contributed by Keith Dunton, Monmouth University, as well as Melissa Cohen, New York State Department of Environmental Conservation, and others purchased in local bait shops and fish stores, she generated 60 new DNA sequences from 18 species which have already been uploaded to GenBank. Nice work Lyubov!
Biodiversity Heritage Library turns 10
In May 2005, under auspices of the Consortium for the Barcode of Life (CBOL), David Schindel organized a meeting in London of a Database Working Group that addressed access to biodiversity literature. Their discussions led directly to establishment of the Biodiversity Heritage Library, a consortium of libraries of natural history museums, under the leadership of Thomas Garnett (Smithsonian, Washington DC) and Graham Higley (Museum of Natural History, London) and to a request for funds, which the Richard Lounsbery Foundation supported 25 April 2006. Jesse Ausubel encouraged the development at each stage. April 11th kicks-off the Biodiversity Heritage Library’s 10th anniversary celebration, “BHL at 10: Celebrating Ten Years of Inspiring Discovery through free access to biodiversity knowledge.” BHL now offers about 50 million pages. Congratulations to all, and enjoy.
ANSI Standards for DNA Barcodes
DNA barcoding gains another level of community acceptance–the American National Standards Institute (ANSI) will publish “Species-Level Identification of Animal Cells through Mitochondrial Cytochrome c Oxidase Subunit 1 (CO1) DNA Barcodes” on January 16, 2016. Mark Stoeckle is a co-author.
DNA barcoding effectiveness supports a new view of how evolution works
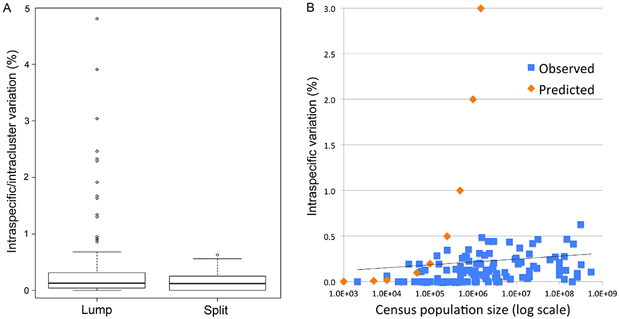
In July 2 PLOS ONE article, “DNA barcoding works in practice but not in (neutral) theory,” David Thaler and I argue a radically different view of how evolution works, as compared to the standard neutral model, is needed to account for the widespread pattern of limited variation within species and larger differences among that underlies the general effectiveness of DNA barcoding. The following text is adapted from the article.
Fig. 1 (from PLOS ONE article). Intraspecific variation in birds is uniformly low across 100,000-fold differences in census population size. Apparent outliers reflect lumping of reproductively isolated populations.
“To to better understand the limits to DNA barcoding and the evolutionary mechanisms that underlie the usual barcode gap pattern, we used birds to test whether differences within and among species conform to neutral theory, the reigning null hypothesis for mitochondrial sequence evolution. We analyzed apparent barcode gap exceptions in detail–those with unusually large intraspecific differences and those lacking interspecific differences.
From a practical point of view exceptions may help define limits to COI barcodes as a marker of speciation. In the context of evolutionary theory, exceptions may give valuable insight into the mechanisms controlling variance within and among species. Birds are uniquely suited this task: they are well represented in barcode libraries, have the best-known species limits of any large animal group, and, most critically, are the only large group with known census population sizes, a key parameter in neutral theory.
Neutral theory predicts intraspecific variation equals 2 Nµ, where N is population size and µ is mutation rate per generation. Although textbooks and scientific reports recognize a multitude of exceptions to this predicted relationship, deviations are subsumed under the rubric of “effective population size” and accounted for by ad hoc modifications to the theory, which is assumed operative.
Here we harness the unique resources of avian barcode libraries and census population data to look at the question the other way around, namely, do the empirical data show any signature of variance proportional to population size? If not, does the observed range of variation fit with commonly proposed modifications to neutral theory? In addition, we examine whether molecular clock measurements conform to neutral theory prediction that clock rate equals µ.
This is the first large study of animal mitochondrial diversity using actual census population sizes and the first to test outliers for population structure. We demonstrate uniformly low intraspecific mitochondrial DNA variation in birds regardless of population size. Nearly all apparent exceptions reflect lumping of reproductively isolated populations (many of which represent distinct species) or hybrid lineages. To our knowledge, this is the first large test of neutral theory applied to mitochondrial diversity using actual census population measurements rather than crude proxies of population size such as phylogeny or body weight, and the first to test outliers for population structure.
In contrast to prior analyses, we find uniformly low intraspecific variation regardless of census population size. Universally low intraspecific variation contradicts a central prediction of neutral theory and is not readily accounted for by commonly proposed ad hoc modifications. We conclude that this finding together with the molecular clock phenomenon are strong evidence that neutral processes play a minor role in animal mitochondrial evolution.
We argue a radically different view of evolution–extreme purifying selection and continuous adaptive evolution–is needed to account for the widespread pattern of limited variation within species and larger differences among that underlies the general effectiveness of DNA barcoding.”
I hope you enjoy!
Barcoding Life Highlights 2013
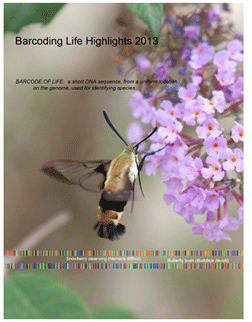 In recognition of the Fifth International Barcode of Life Conference opening next week in Kunming, China, we offer Barcoding Life Highlights 2013.
This eight page pdf takes a look at notable developments since the 2011 conference in Adelaide, Australia, offers a big picture view of barcoding’s flourishing first decade, and features hot links to papers, organizations, and databases.
We hope you enjoy!
IBOL Targets and Milestones Review
Download PDF: IBOL Targets and Milestones Review
Summary
This is a report on a review of iBOL targets and milestones at the project’s mid-point. The review was carried out in consultation with the iBOL Scientific Steering Committee (SSC) and over 65 other iBOL participants and other DNA barcoding stakeholders. Acknowledging that this review is based on information provided by a cross-section of global DNA barcoding stakeholders at a single point in time, and cannot therefore be viewed as comprehensive, the key ?ndings and recommendations are summarized as follows:
Findings
- The DNA barcoding stakeholders consulted in this review af?rm iBOL’s goals (i.e. to build a global accessible library of DNA barcodes for eukaryotes and promote applications for science and society), but also raise concerns and note conditions for success. These include concerns about the tension between data quality and quantity.
- As part of iBOL’s numerical targets, approximately 1 million specimens will need to be barcoded to support applications. There is a higher quality requirement for these specimens, particularly in relation to how well they are identified.
- The extent to which these 1 million specimens overlap with the growing DNA barcode reference library is unknown. What is the identity of these specimens? If and when the numerical target of 5 million specimens is reached, will it include them? If not, the success of iBOL’s Goal B – the promotion of applications of DNA barcode data fro science and society – is potentially at risk.
- The combined, planned efforts of the DNA barcoding stakeholders consulted for this review will result in the barcoding of approximately 4 million preserved specimens and 2.8 million newly collected specimens. Well over 200,000 additional preserved specimens and approximately 1 million additional newly collected specimens could (and would) be made available for DNA barcoding at an external sequencing facility, if funding to support that sequencing could be identi?ed. Thus the provision of specimens is unlikely to be a rate-limiting factor in meeting iBOL’s numerical targets.
- The sequencing infrastructures of the existing DNA-barcoding facilities are sufficient to meet iBOL’s goals – both the numerical targets and in terms of supporting applications – but these infrastructures are not operating at full capacity. Funding is the limiting factor.
Recommendations
- Subsequent to this review, a more in-depth follow-up activity should be undertaken to generate the information and tools needed to establish a stronger and more deliberate connection between iBOL’s goals and the specimen-to-barcode supply chain. This “matchmaking service” should enable the use of wish-lists of species needed to support applications to identify sources of priority specimens. The development of such a service – which would need to be done at the level of species names – is well beyond the scope of this review. It will require contracting a bioinformatics-savvy postdoctoral level research assistant for perhaps 6-12 months, full-time, to create databases on both ‘goals’ and ‘supply chain’ sides, and a tool to match them.
- To use this matchmaking service in support of iBOLs goals, a rigorous and transparent mechanism will need to be put into place to facilitate the movement of priority specimens identi?ed through the service through the specimen-to-barcode supply chain, and to promote and ensure the higher standard of quality required for specimens that support applications.
- Barcoding stakeholders who participated in this review af?rm that an important iBOL priority is broad phylogenetic coverage across eukaryotic life. Thus, in terms of the de?nition of targets and milestones under the SSC’s Theme 1 in support of iBOL’s Goal A, this review recommends the establishment of a a new “breadth target” on top of existing numerical targets for each Working Group.
- Finally, this review recommends that iBOL explore opportunities for securing funding to support the full utilization of existing but dormant sequencing infrastructures for DNA barcoding. The establishment of a “matchmaking service” as recommended above will support and inform any funding proposals that might emerge from this review.
Phylogenetically diverse COI dataset extends evidence that rare variants are often errors
In October 2012 Nature 490:535, Breen and colleagues reported on amino acid variation among 13 mitochondrial protein and 2 nuclear proteins based on alignments of 3,000-53,000 sequences representing 1,000 to 14,000 species. They found that on average, a given site in a protein accomodates 9 different amino acids. Based on the distribution of variants, they conclude that epistasis (interaction among genes) strongly constrains molecular evolution.
Here Kevin Kerr and I re-analyze their large COI dataset [19,000 sequences (8,300 human); 4,700 species], generously provided by senior author Fyodor Kondrashov. Our aim is to determine if the frequency matrix approach we applied to avian BARCODEs (PLoS ONE 2012 e:43992) can be used to identify errors in a more phylogenetically diverse dataset. As the authors note, sequencing error is a potential confounder for their analysis; they used a different approach to assess error than we present here.
Brief methods. COI nucleotide alignment opened in MEGA, translated using appropriate table (~95% of COI dataset is insects or vertebrates), and exported to Excel; frequencies calculated at each amino acid position, and amino acid letter sequences converted into amino acid frequencies. For this analysis we defined rare variants as amino acids present in fewer than 0.02% (1/5000) sequences. In this dataset, rare variants comprised about half (46%) of the total amino acid diversity. For analyses illustrated below, we excluded the 8,281 human sequences, which had very few (8) rare variants.
Results
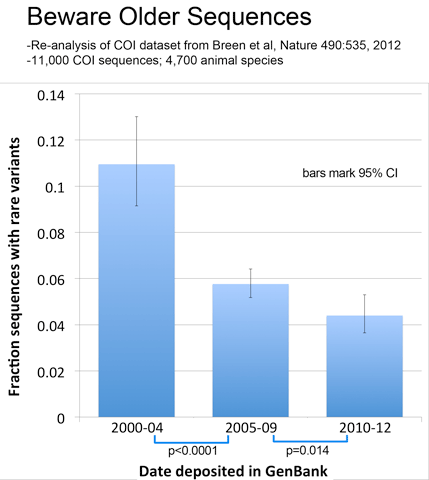
As observed with avian BARCODEs, rare variants in this dataset were less common in newer sequences, consistent with improved sequence quality over time.
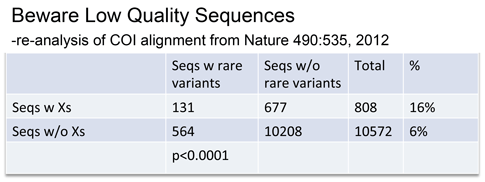
Rare variants were associated with low quality sequences–those with internal N’s, generating unknown “X” amino acids.
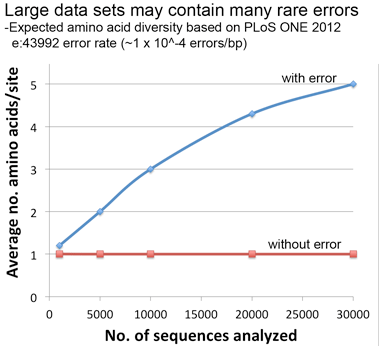
Lastly, a thought experiment applying the error rate from our PLoS ONE paper suggests that significant artifactual amino acid diversity is expected when error rate x dataset size is equal to or greater than 1, conditions that may be met by large datasets particularly those containing older sequences as in this COI alignment.
These results reinforce our published observation that a frequency matrix approach is a useful and important tool for analyzing error among large datasets. We hope that others will utilize this approach.
Regarding the findings of Breen and colleagues, our re-analysis suggests that error makes a greater contribution to amino acid diversity in this dataset than that calculated by authors, although the main conclusion of their paper regarding epistasis would likely be unchanged.
DNA barcoding a hardy urban denizen
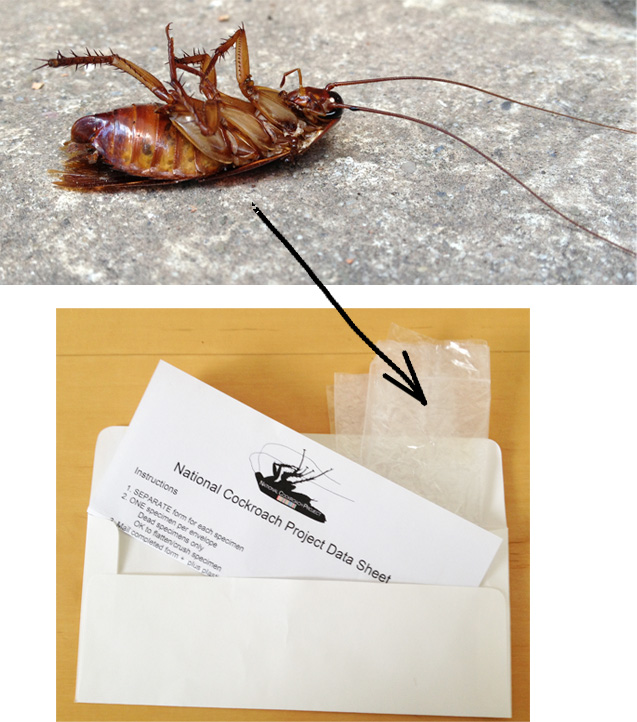
 In 2009, high school students found novel DNA barcode types in American cockroaches (Periplaneta americana) in New York City (DNAHouse). Hoping to learn more about this feared and despised yet ineradicable urban denizen, we are starting a National Cockroach Project. A quick summary so far:
What High school students and other citizen scientists collecting and helping analyze American cockroaches using DNA barcoding.
Why Genetic diversity is a window into evolution and patterns of migration. American cockroaches originated in Africa and hitchhiked around the world on commercial goods. This project asks:
 Do American cockroaches differ genetically between cities?
- Do US genetic types match those in other parts of the world?
- Are there genetic types that represent undiscovered look-alike species?
How To participate, collect a cockroach!
What you need
- American cockroach (dead)
- Specimen label with collection location, date
- Mailing materials (form with instructions on NCP home page)
What you get
- Thrill of scientific discovery using DNA
- Cool, icky topic to talk about with friends
- DNA sequences you can analyze to study evolution
For more information including how to track down and identify an American cockroach, see NCP home page. I hope you will find this project fun and participate in the crowd-sourced collection effort!
