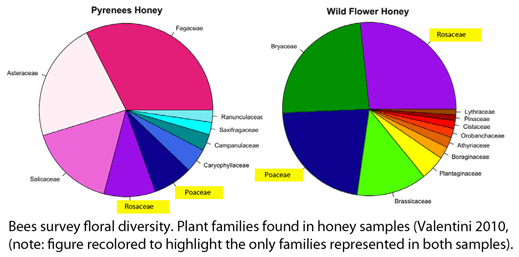
As in last week’s post on what deep-water sharks eat, DNA-based species identification helps reveal how animals live, not just what species they are. Diet analysis can also provide a survey of what prey/food species are in the local environment. In April 2010 Diversity, researchers from Université Grenoble, France, apply standardized DNA identification targeting chloroplast trnL intron P6 loop and massively parallel sequencing to examine plant DNAs in honey. The traditional approach for determining geographic and botanical origins of honey is microscopic examination of pollen, which requires expert training.
As previously described, the trnL P6 intron is tiny (10-143 bp) and has highly conserved flanking sequences, enabling successful amplification of DNA from many or most plants, including from degraded samples. The major disadvantages are relatively low taxonomic resolution, which is improved if sequences are matched to local rather than global flora, and a modest reference library. Interpreting PCR-based results from mixed samples can be complicated, as there may be preferential amplification of some sequences and not others.. To my knowledge, this has not been studied for trnL P6 approach in general or as applied to honey in particular.
Valentini and colleagues extracted DNA from 10 mg samples of honey (one from a commercial “wild flower” blend and a one from local Pyrenean region) using a standard kit (Qiagen), amplified the P6 loop with broad-range primers, and performed pyrosequencing on a Roche Diagnostic G20 system. Different nucleotide sequence tags were applied to the two samples, enabling both to be analyzed in a single pyrosequencing run; the authors point out that tagging could be expanded to enable analyzing hundreds of samples in a single run. A total of 3,671 and 2,191 sequences represented at least 3 times were obtained from Pyrenean and mixed wild flower honey, respectively, which were matched to 22 and 26 plant taxa, respectively. In terms of taxonomic resolution, these were mostly family or generic level assignments: 9 families/subfamiles/tribes, 7 genera, and 6 species (Pyrenean), and 14 families/subfamilies/tribes, 8 genera, and 4 species (mixed wild flower). In both samples, the five most abundant taxa comprised about 75% of total sequences.
Valentini and colleagues note that “several of the plant taxa identified were not the result of nectar collection” (moss, fern, pine), and were presumably due to wind transport from nearby plants. The fern species identified, Athyrium vidalii, which comprised 1.9% of sequences, is distributed in China, Japan, Korea, and Taiwan, evidence for the geographic origin of the honey. Documenting geographic origin of honey products is of commercial interest.
A primary advantage and rationale for DNA barcoding is that standardizing on one or a few regions enables a comprehensive reference library and broadly-applicable testing methods. The trnL P6 target utilized in the present study is not part of the published community standard of rbcL + matK targets (A DNA barcode for land plants, Hollingsworth et al PNAS 2009), so it remains to be seen when this will be widely used. In any case, authors conclude that their method is “fast, simple to implement, more robust than classical methods” and “opens new perspectives in the analysis of honey diversity.” I look forward to learning more!
