DNA barcode databases are a kind of wikipedia of DNA identifiers, with contributions by thousands of researchers. How accurate are they? How do records that meet the BARCODE standard compare to routine GenBank records? How many BARCODE records represent pseudogenes masquering as their functional counterparts?
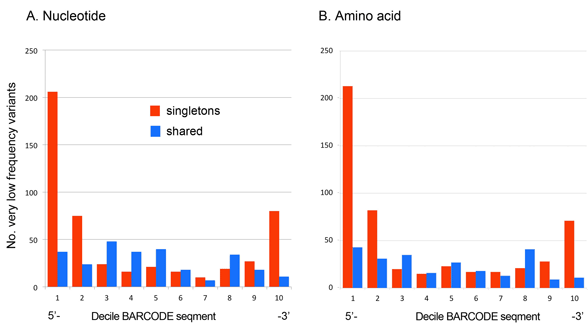
In case you missed this, Kevin Kerr and I recently analyzed sequencing error among 11,000 avian BARCODEs representing 2,700 bird species (PLoS ONE e43992 2012), using a frequency matrix approach to look at patterns of variation. As illustrated below, we found that very low frequency nucleotide variants (VLFs) found in single individuals of a species (labeled “singletons” in figure) are strongly concentrated at the ends of the barcode segment, consistent with sequencing error.
In contrast, very low frequency variants found in two or more individuals of a species (labeled “shared” in figure) provided a nice control–these were relatively evenly distributed, consistent with biological origin. Not surprisingly, given that most of the very rare nucleotide variants were associated with amino acid substitutions, very rare amino acid variants showed the same distribution patterns. 
In addition to analyzing sequencing error, we closely examined the small fraction (0.1%) of BARCODEs with multiple very low frequency variants shared among individuals of a species. Based on review of trace files deposited as part of BARCODE standard, these unusually divergent versions of COI turned out to be overlooked cryptic pseudogenes lacking stop codons!
We were able to calculate an error rate for the dataset, using observation that most (94%) second codon positions were >99.9% conserved, which meant that nearly all sequencing errors at second position sites would be detectable as very low frequency (<0.1%) variants. The calculated upper limit of sequencing error was 8 x 10⁻⁵ errors/nucleotide, which is 1-2 orders of magnitude higher than generally cited for direct Sanger sequencing of amplified DNA, but unlikely to compromise species identification. Overall, we found about 3% of BARCODEs have 1 or more errors (ave 1.4). To our knowledge, this is the first assessment of sequencing error for a large public sequence database with multiple contributors. It might be useful to annotate those records with probable sequencing errors or that represent cryptic pseudogenes; I believe that annotation is possible in BOLD and not in GenBank.
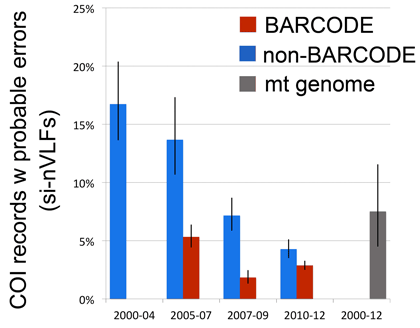
 In addition to confirming the high quality of the avian BARCODE database we were able to demonstrate significant quality improvement in avian BARCODE and non-BARCODE COI records deposited in GenBank over the past decade as shown at right (bars indicate 95% confidence interval).
The frequency matrix we describe has potential application for genetic database quality assessment, discovery of cryptic pseudogenes, and studies of low-level variation.
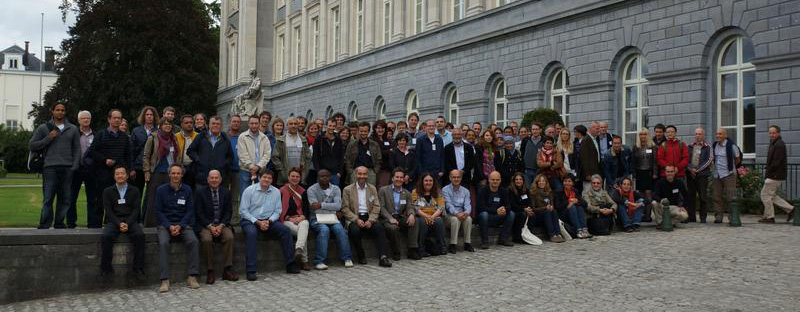
Our results were presented at the Third European Congress for the Barcode of Life (ECBOL3) held at Royal Flemish Academy of Belgium for Sciences and the Arts (KVAB) in Brussels in September (group photo below).
Powerpoint based on PLoS ONE article is available here: freq matrix stoeckle 8nov2012
