In December 2010 Mol Ecol, researchers from University of Alaska Museum compare mitochondrial and nuclear DNA differences among 9 pairs of bird populations, subspecies, or species, with a total of 162 individuals from 12 species analyzed. What did they find? Their gloomy conclusion is “our results suggest that using a genetic divergence estimate from part of an organism’s genome does not accurately represent organismal divergence and that commonly used measures are not strongly correlated with the speciation process.” I translate this as “DNA barcoding is not reliable.” Since we already have large surveys demonstrating effectiveness of DNA barcoding in more than two thousand bird species, their findings are surprising. Let’s go to the data.
For mtDNA, Humphries and Winker analyzed 1037 bp of ND2 (why not COI!) and employed Amplified Fragment Length Polymorphism PCR (AFLP) to assess differences in nuclear DNA. AFLP is a widely-used, indirect method of assessing nuclear genome differences that to my knowledge has never been compared to whole genome sequencing. Counting differences among aligned mtDNA sequences is straightforward. For AFLP, interpretation is more complex–in this study the banding patterns were converted to FST (fixation index) values using “AFLP-SURV 1.0 with the Bayesian method with uniform priors and 10,000 random permutations to test for significant levels of differentiation.”
The researchers chose 3 pairs of populations, subspecies, and species in 3 orders of birds that live in Alaska or Russia. The study design had two aims, first, do levels of genetic distances follow taxonomic categories, i.e. are differences among species > subspecies > populations? Contrary to their conclusion, my answer is yes, as there were no mtDNA differences between populations, and differences among subspecies and species ranged from 1.99-5.48%. Two of the three subspecies pairs are already recognized as different species by some authors, and the third pair is divergent enough (3.02%) to likely represent different species. So I conclude there are really just two categories–populations, which had no mtDNA differences, and species or candidate species, which showed a typical range of divergences. It is puzzling that the discussion did not include the possibility that taxonomy is imperfect rather than DNA data being misleading. The second question addressed by this study is: do nuclear DNA distances co-vary with mtDNA differences? The answer turned out to be no, which I find interesting but of uncertain significance. It may be that AFLP analysis of nuclear DNA is not a reliable indicator of divergence time or species status, at least in comparisons across lineages. Here more data is needed. To my mind, AFLP is a little bit like acupuncture–it may work, but we don’t understand why, so it’s hard to be confident in its application. Patterns of variation in the human genome revealed by whole genome sequencing have turned out to be much more complicated than expected, and I expect there will be a flood of data using whole genome sequencing to look at species boundaries.
For a lasting, publicly useful contribution to science, I hope that the many researchers who are analyzing mtDNA differences among animal species will include barcode region COI if not doing so already. The mitochondrial genome evolves in close but not exact parallel, and there is no particular reason to pick one coding region over another. By analyzing barcode region COI and depositing their sequences and associated collecting data in BOLD and GenBank, researchers can amplify the value of their work. For birds, the BOLD COI database helps identify remnants from bird-airplane collisions, leading to improved airline safety. For studies such as this, by analyzing COI the researchers can easily combine their results with existing records, adding power and potentially new insights to their analysis.
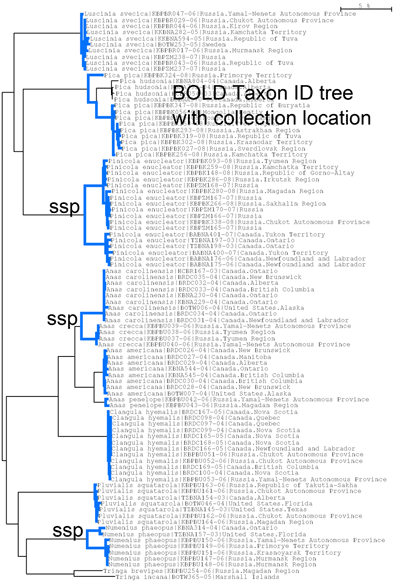
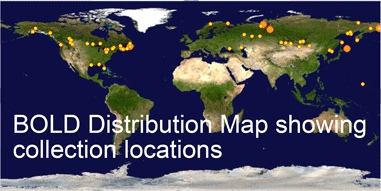
To give an idea, I went to BOLD, merged the “Birds of North America” and “Birds of Eastern Palearctic” projects, selected all records for the 12 species in this study, and generated an NJ tree (blue highlighting added to species branches) and a Distribution Map of where the specimens were collected. The highly divergent subspecies pairs are immediately evident. It would be of interest to see where the specimens from this study fit, and this would help build a highly detailed online map of genotype distribution, something that does not yet exist for any animal species. An exciting prospect!

