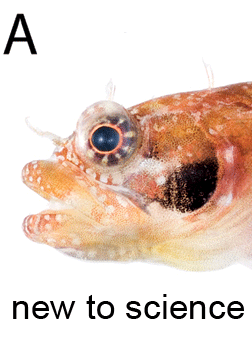
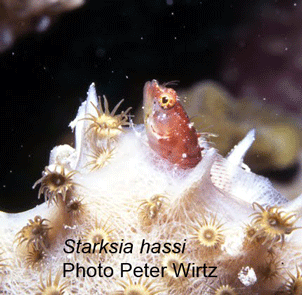
 Starksia is a genus of tiny (most less than 2 cm) blennoid fishes found in rocky inshore areas and coral reefs along the Atlantic and Pacific coasts of North and South America and the Caribbean. In 11 February 2011 ZooKeys (open access) researchers from Smithsonian Institution, Ocean Science Foundation, and Nova Southeastern University describe 7 new western Atlantic Starksia species which they first discovered through DNA barcoding.
DNA barcoding revealed divergent clusters within four previously described species and careful re-inspection revealed morphologic characters associated with each genetic cluster. It is interesting that many of the distinguishing characters are around the head, which may fit with fact that these fish often spend their time largely hidden with only the head exposed. The ZooKeys article is about 51 pages, or about 7 pages per new species, which I think is about average for a species description. If there were a similar printed key for all fishes (about 25,000 named species so far) that would be 175,000 pages long, which is one reason that methods for non-specialists are needed! Of course keys can be posted on the web, as this is, but it is still a challenge to find the right key, especially if you don’t already have a good idea of what you are looking at.
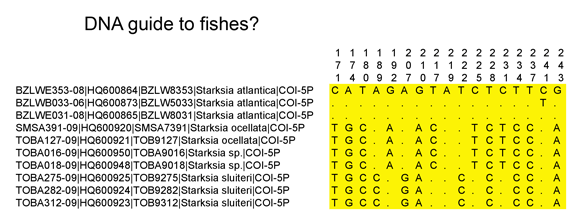
 I was surprised that the key did not include barcode sequences of the holotypes (primary specimen chosen to represent the species) (of course these are in GenBank). Even better might be a table of the diagnostic barcode differences among these species, a molecular key. To try this out, I downloaded the Starksia sequences from Public Projects section of BOLD www.barcodinglife.org, opened in MEGA (free sequence analysis software available at www.megasoftware.net), highlighted all positions that differed among the set, and exported these to Excel including the position numbers which are shown at the top. An excerpt of the output is shown below.
This sort of display could be useful including in a legal setting when you need to document the basis for identification by barcode. The NJ tree gives the right answer of course but it is an abstract representation of the data. A table such as above would show the actual nucleotide sequence differences which are used to generate the tree.
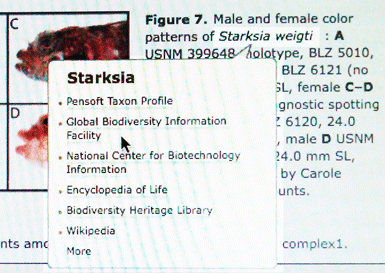
 Addendum: I meant to include this very neat feature reading the ZooKeys article online, which is a menu of links that appears if you place your cursor over any species name!
It is indeed regrettable that these authors did not follow the format of Victor when he included the barcode of the holotype in his description of Coryphopterus species. I suspect that this was too much of a departure from established orthodoxy for some collaborators on this paper – but the fact remains that considerable disambiguation in the application of names can be achieved if barcodes are indeed included in type descriptions! Imagine a world where all new species descriptions were accompanied with barcodes for the types – that would be real progress.