On Earth, the quarterly magazine of the NRDC, published a detailed article, The (New) Web of Life , by Alan Burdick about the history and progress of the Encyclopedia of Life.
News
Identifying ocean’s racehorses with DNA
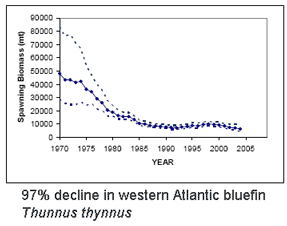
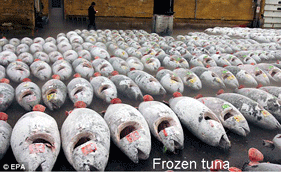 Bluefin tuna are enormous (up to 15 ft/4.5 m, 680 kg/1500 lbs), high-speed (up to 54 km/h, as fast as racehorses) creatures that roam across oceans and return to ancestral waters to spawn. High demand has fueled intensive fishing by international fleets, resulting in 90% population declines heading towards extinction for all three species, Southern (Thunnus maccoyii), Northern (T. thynnus), and Pacific bluefin (T. orientalis). This week in PLoS ONE researchers from the American Museum of Natural History describe DNA-based identification of bluefin and other tuna species using character analysis of COI barcode sequences. Lowenstein and colleagues’ report provides a basis for routine identification of marketplace items to inform consumers and enable enforcement of regulations, including a proposed listing as endangered under Convention of International Trade in Endangered Species (CITES).
 The eight species in genus Thunnus are not discriminated by regularly used nuclear loci and differ by about 1% or less in mitochondrial coding regions (e.g., Ward et al 2005 Phil Trans R Soc B), challenging DNA-based identification. To construct a diagnostic key, Lowenstein and colleagues analyzed 89 COI sequences in GenBank representing the eight tuna species and by visual inspection found 14 sites that provided 17 “compound characteristic attributes (CAs)” (terminology from Sarkar et al 2008 Mol Ecol Res). Turning marketplace detectives, the AMNH team collected 68 sushi samples from 31 establishments in New York and Denver over 6 month period in 2008. Nearly one-third (22; 32%) of samples were sold as species contradicted by the molecular data, including items from over half (19; 61%) of the restaurants.
Lowenstein found their character-based identifications were more accurate and precise than those provided by BOLD ID engine (www.barcodinglife.org), largely reflecting that the ID engine uses a 2% cutoff for assigning specimens to species, which encompasses all eight Thunnus sp. In addition, BOLD is a workbench for researchers and so contains many as yet unpublished sequences from ongoing studies; these need to be viewed as provisional data. Indeed, in constructing their key Lowenstein and colleagues set aside 2 of the 89 GenBank tuna sequences as these grouped with other species. These anomalous sequences might reflect hybridization or introgression which is reported to occur in 2-3% of Atlantic bluefin, for example (Viñas and Tudela 2009 PLoS ONE). In this study, researchers from Universitat de Girona, Spain and World Wildlife Fund describe a DNA-based method for distinguishing tuna species using mitochondrial control region and nuclear ITS. Here again the method is validated using published data, in this case 42 GenBank records representing the 8 species. As an aside, I find it remarkable there are so few records that might enable identification of such commercially-important and now endangered species. These two studies establish a scientific and possible legal standard for tuna identification. Now we begin.
Tracking disease vectors with DNA
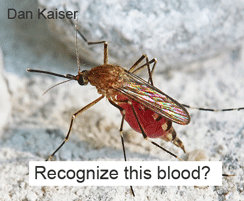 What hosts sustain arthropod disease vectors when they are not biting humans? In September 2009 PLoS ONE, researchers from Doñana Research Station, Seville, Spain, report on a “universal DNA barcoding method to identify vertebrate hosts from arthropod bloodmeals.” The investigators collected “wildlife engorged mosquitoes, culicoids [biting midges] and sand flies (Phlebotomiae)…using CDC traps supplied with dry ice to attract ectoparasites through light and CO2.”
To design vertebrate-specific primers that would not amplify the more abundant arthropod DNA, Alcaide and colleagues “downloaded all vertebrate COI sequences (N = 18,2980 from the Classes Mammalia, Aves, Amphibia, and Reptilia that were available in the public domain managed by BOLD Systems database in January 2009” and compared these to “6,784 arthropod COI sequences from taxonomic groups that included blood-feeding species.” From this comparison they designed degenerate (multiple nucleotides at some positions) primers that were >99% matched to vertebrate target sequences and >99% mismatched to invertebrate targets. It would be helpful in this and other studies if the description of new primer(s) gave the position of the 3′ end of each primer as compared to mouse mitochondrial COI for instance. This would make it clear which portion of the COI barcode region is being amplified.
The first pass test with these primers gave PCR products in 43 of 100 mosquito bloodmeals, and reamplification with a slightly different primer set yielded sequenceable products in 97 of 100 cases; this re-amplification protocol was applied to the other vector species with “satisfactory” results. All except 5 matched at >99% level to vertebrate sequences from museum voucher specimens. For 3 of the uncertain identity sequences, they used the closest BOLD matches and knowledge of local fauna to “deduce that these species could be the Iberian hare Lepus granatensis, the red-legged partridge Alectoris rufa and the Egyptian mongoose Herpestes ichneumon.” The other two without close matches were from ticks collected while still feeding so the hosts were known. By my count they detected 18 mammalian and 26 avian host species in arthropod bloodmeals; to me this is remarkable variety given the relatively small number of bloodmeals tested. I look forward to learning more through DNA tracking of biting arthropods.
Tropical tree identification with DNA
 Two groups of researchers explore tropical forest plots with DNA barcodes in October 2009 PLoS ONE and Proc Natl Acad Sci USA (both open access, the latter Twittered!). It is just three months ago a community standard for DNA barcoding land plants was announced, namely the plastid genes rbcL and matK, with species-level identification in 72% of cases tested and identification to “species groups” in the remainder. The two papers mentioned above represent the early roll-out so we can expect much more will be learned about DNA barcoding in plants in particular and about plant biology in general.
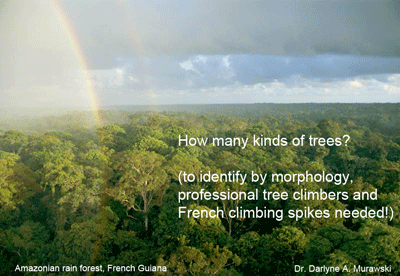
In PLoS ONE, researchers from France, French Guiana, and New York apply DNA barcoding to two 1-hectare plots in the “pristine lowland tropical rainforest” of central French Guiana, which represents one of the largest tracts of intact Amazonian rainforest. Working out of the Nouragues Research Station (“gateway to European rainforest”) Gonzales and colleagues collected leaf and cambium (living outer layer of wood) samples from all trees 10 cm or greater in diameter, with the assistance of professional tree climbers for large trees and use of climbing spikes for smaller specimens. The extreme efforts required to collect morphologically-identifiable specimens highlights the desirability of a DNA-based approach that could be applied nearer to ground level! A total of 1073 trees were sampled, which were sorted into 301 morphospecies; of these, 254 (85%) were “matched to a reference voucher with an acceptable species name…[encompassing] 143 genera and 54 angiosperm families, so that is a lot of tree diversity! For comparison there about 1000 native tree species in all of North America. PCR was carried out for multiple loci: in addition to above-mentioned standards rbcL and matK, these included plastid genes rpoC1, rpoB, and ycf5, non-coding trnL and psb-trnH, and nuclear ITS. The researchers also applied DNA barcoding to “juveniles” i.e. saplings in the same plots, of which just 27% could be identified to species, plus another 45% to morphotype, and 11% to genus (this leaves 17% not identified to genus). Not surprisingly given the diversity of species, sample types, markers, and uncertainties in the underlying taxonomy, the researchers’ results are complex. Regarding tissue types, they obtained amplifiable DNA from most or all leaf and cambium samples, with high success for some markers (e.g., rbcL sequencing rate 93%), supporting ground-level sampling strategies. Regarding markers, they had difficulty amplifying matK (68% success) and ITS (41%). Similar to prior observations, the overall rate for species-level identification using plastid markers plateaued at about 70%, thus two loci capture most of what is available from this genetic compartment.
In Proc Natl Acad Sci USA, researchers from Smithsonian Institution, Smithsonian Tropical Research Institute (STRI), Imperial College, and Harvard University apply DNA barcoding with rbcL, matK, and trnH-psbA to 1035 tree samples representing 296 species in STRI’s 1,000 x 500 m Forest Dynamics Plot on Barro Colorado Island, Panama. They had similar sequencing success to Guiana study (rbcL, 93%; trnH-psbA, 94%; matK, 69%). Overall success at species-level identification was 92% for rbcL + matK; 95% for rbcL + trnH-psbA, and 98% for all three markers, with the denominator in these comparisons apparently being #samples with available sequences. I am uncertain as to why species-level identification was higher in Panama as compared to Guiana study; the total number of samples and species is similar so presumably this reflects particular aspects of the species composition such as recent radiations in these locations. Kress and colleagues constructed a supermatrix with this data, generating a “robust community phylogeny for 281 of the 296 species in the plot.” They conclude “DNA barcodes stand poised to serve as an efficient and effective approach to building community phylogenies…[aiding] understanding niche conservation and the dynamics of species composition at landscape and global scales.” Sounds promising!
World species census updated
How many species are there? One widely cited estimate, now 24 years old, is 1.7 million named species (EO Wilson 1985 Science 230:1227). This estimate is updated in detailed form in September 2009 publication from Australian Government “Numbers of Living Species in Australia and the World, 2nd edition” by Arthur Chapman (illustrated report open access for perusing online or as pdf for download). According to Chapman’s analysis, there are 1.9 million published species in the world. Approximately 18,000 new species are described each year, 75% of which are invertebrates, 11% vascular plants, and 7% vertebrates. Chapman estimates the true number of world species is about 11 million. The largest uncertainties, for which it is estimated fewer than 10% of species have been named, are for fungi, single-celled eukaryotes (protocista, cyanophyta, chromista), and “prokaryotes”, i.e. eubacteria and archaea.
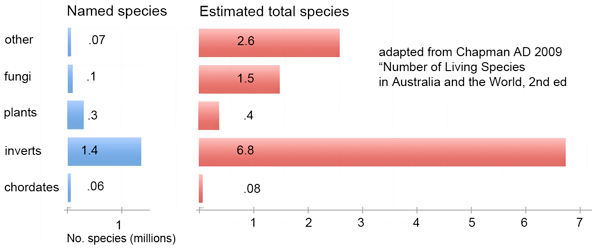
This overview brings to mind pictures of the distribution of matter and dark matter in the universe. On a large scale, is the “density” of species uniform? For example, given there about about 10,000 bird and about 40,000 fish species, do fish take up 4x as much diversity space? We know on a small scale there are some “high-density” closely-related groups of species, like cichlid fishes in Africa, but can we map the distribution of diversity on a larger scale? Large databases of homologous sequences representing diverse species (aka DNA barcodes; as of today, BOLD has over 700,000 records representing over 64,000 species) and new mathematical approaches to calculating diversity from nucleotide sequences (eg Sirovich 2009 PLoS ONE; I am co-author) may help provide a biological macroscope (Ausubel PNAS 2009) for understanding the genetic structure of biodiversity, complementary to the historical view expressed in the Tree of Life.
A Scalable Method for Analysis and Display of DNA Sequences
Together with colleagues at Mt. Sinai School of Medicine, we report a new mathematical approach to the genetic structure of biodiversity, using indicator vectors calculated from short DNA sequences. Sirovich L, Stoeckle MY, Zhang Y (2009) A Scalable Method for Analysis and Display of DNA Sequences. PLoS ONE 4(10): e7051. This method is scalable to the largest datasets envisioned in this field and provides a macroscopic view of “biodiversity space”. It offers a complement to tree-building techniques and could enable automated classification at various taxonomic levels.
From the Abstract:
The indicator vectors preserved DNA character information and provided quantitative measures of correlations among taxonomic groups. This method is scalable to the largest datasets envisioned in this field, provides a visually-intuitive display that captures relational affinities derived from sequence data across a diversity of life forms, and is potentially a useful complement to current tree-building techniques for studying evolutionary processes based on DNA data.
To download zip files containing MatLab code and datasets utilized in this paper, select the following links:
- PLoS_ThreeGroups_v1_2.zip (updated March 2010)
- PLoS_Bird_Analysis_v1_2.zip (updated March 2010)
Technology will save us
The 23 September 2009 issue of New Scientist magazine publishes an interview about population with Jesse.
Finding out what small herbivores eat
What do animals eat? For many animals other than large, diurnal, terrestrial species, this is surprisingly hard to study. In August 2009 Frontiers Zool researchers from Norway and France apply standardized DNA analysis, and compare with microscopic techniques, for diets of two arctic voles, Microtus oeconomus (Tundra vole) and Myodes rufocanus (Grey red-backed vole) collected in July and September in northern Norway. Soininen and colleagues analyzed stomach contents of 48 individuals using a microscope and a DNA sequencer, the latter to analyze amplified P6 loop (length 10-46 bp) of chloroplast trnL intron. As previously described by some of the same authors (Taberlet et al 2007) P6 loop is amplifiable from diverse gymnosperms and angiosperms with a single set of primers, however not surprisingly this very short segment often does not provide species-level identification even with local flora.
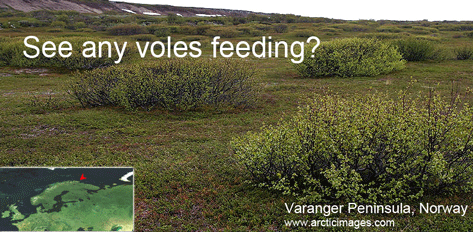
For microhistological analysis, the authors first prepared a photographic guide by collecting samples of all vascular plant species in study area; the samples were dried, scraped to reveal epidermis, bleached, boiled in table vinegar, then 40x micrographs were taken. Stomach content samples were filtered, bleached, and 1 droplet was examined on a microscope slide, counting 25 bits of identifiable material; if >95% of material was unidentifiable, a new slide was prepared. In 4 individuals, no slide with adequate amount of microscopically identifiable material count be made. For DNA analysis, The P6 loop was amplified, using tagged primers that identified each individual, and the pooled material was analyzed by pyrosequencing, and the sequences were compared to a database of 842 species representing “all widespread and/or ecologically important taxa of the arctic flora”. With standardized DNA approach (the authors call this DNA barcoding although it does not use recently agreed-upon standard loci) “75% of sequences were identified at least to genus level, whereas with microhistological method, less than 20% of the identified fragments could be specified at this level”.
As a result of greater resolution as compared to microscopy, DNA identified more plant species and genera in vole diets (for M. oeconomus, 13 species/9 genera vs 9 species/5 genera; for M. rufocanus 17 species/8 genera vs 11/7). Both methods showed large variation among individuals. Limitations to DNA approach include possible overrepresentation of species with chloroplast-rich tissues and inability of P6 to detect fungi, horsetails, and mosses. Looking ahead, researchers conclude “DNA-based technology makes it possible to study vole-plant interaction by non-destructive sampling of faeces in the natural habitats of voles”, first identifying rodent species using a mitochondrial DNA marker (and potentially sex and individual identification with Y-chromosome and microsatellite detection) and then diet analysis. I conclude standardized DNA analysis opens wide avenues for ecology.
Counting zooplankton diversity with DNA
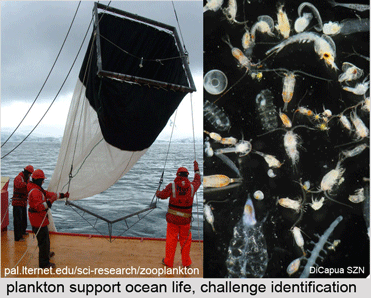 Marine zooplankton comprise an enormous mass of diverse organisms distributed throughout the world’s oceans from deep waters to surface. Zooplankton include representatives of at least dozen phyla, some of which are larval forms of much larger animals, and challenge identification with their diversity and tiny size. In current BMC Genomics (open access) researchers from University of Tokyo and Osaka Medical College, as part of Census of Marine Zooplankton (CMarZ) program of the Census of Marine Life (CoML), apply single-gene sequencing to the task. Machida and colleagues collected at a Micronesia site using a single pass with 2m^2 plankton net from depth of 721 meters to surface, obtaining 60 mL of of zooplankton (large organisms, up to 4 cm, were discarded). Rather than direct DNA sequencing, the researchers isolated mRNA from the pooled sample and constructed a cDNA library from which they analyzed 1,336 inserts. The rationale for these extra steps was to avoid sequencing pseudogenes present in genomic DNA (but not transcribed into mRNA). It would be interesting to know if this strategy was based on experience or is a theoretical precaution.
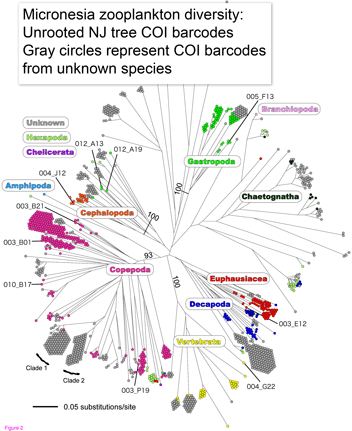 Machida and colleagues found evidence for 189 species, only 10 of which could be confidently matched to reference sequences. This report demonstrates that this sort of “kitchen blender” approach, which has previously been applied largely to bacterial and archaeal communities, shows promise for assemblages of eukaryotes and reveals surprisingly few organisms have reference sequences in databases. Identified organisms included several copepods as well as presumably larval forms of Sthenoteuthis oualaniensis (Purple-back flying squid) and Coryphaena hippurus (Common dolphinfish)!
Species identification by DNA opens major avenues for for ecosystem research. The NJ tree at left suggests that even in absence of close matches, 500 bp of mtDNA is sufficient to sort most specimens into appropriate higher-level groups. To better understand the changing oceans, we need biological monitoring machines akin to physical instruments for studying weather and climate, which routinely monitor thousands of sites. It seems to me the only practical way to monitor biological “weather” is by repeatedly sampling species assemblages at multiple points, and particularly in aqueous environments, automated species identification with DNA will be an important analytic method.
DNA data to help save bushmeat animals
Harvesting wild animals for sale as food is a large, mostly illegal business that threatens wild animal populations and puts humans at risk for exotic infections, witness the SARS outbreak in 2003. Regulations and treaties exist, but before these can be enforced, one needs to establish the species origin of bushmeat and other derived marketplace products. Here DNA can help. In 1 September 2009 Conservation Genetics (open access article) researchers from University of Colorado, Barnard College, and American Museum of Natural History describe DNA barcodes for 23 species of South American and Central African primates, ungulates, and reptiles regularly harvested for bushmeat. Equally important as the DNA sequences, Eaton and colleagues report high success (179/204 samples (87.7%)) with primer cocktails first developed for fish DNA barcoding by Ivanova et al 2007, demonstrating these can serve as universal vertebrate primer cocktails. Intraspecific variation was low (mean 0.24%) and differences among congeneric species was generally high (average 9.77%), making assignment to known species straightforward using either tree-based maximum likelihood or character methods.
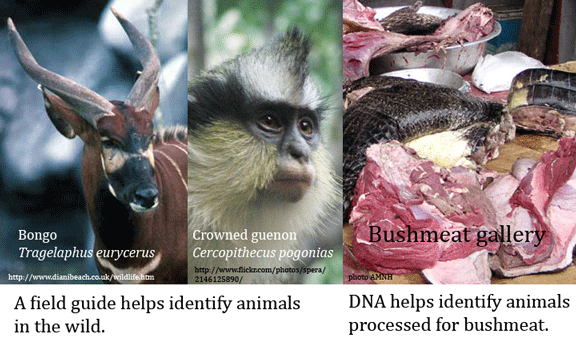
This report is focused on documenting barcodes of bushmeat species, using well-identified vouchered specimens (1 vouchered specimen labeled as Melanosuchus niger (Black caiman) was found to be Caiman yacare (Yacare caiman). The researchers did test a handful of unknown or partially identified specimens; all with recoverable COI sequences could be assigned to known species in the data set using the tree-based or character methods as described. Remarkably, Eaton and colleagues were able to recover COI DNA from 1 of 5 leather goods, which had been impounded by the US Fish and Wildlife Service as likely of CITES species origin. This proved to be Crocodylus niloticus (Nile crocodile). Recovering DNA from leather suggests many unsuspected household items have legible DNA barcodes.
I only wish the research report could have included pictures–there is so much more we might learn. There is an AMNH webpage describing the project which has several interesting images, although these are unlabeled and not referred to by the text. Perhaps we need a “mash-up” utility into which one could insert a scientific paper, which then would pull in relevant material–images, maps, links. Along these lines, there is a very neat Encyclopedia of Life NameLink utility which automatically detects scientific names and inserts hyperlinks to relevant EOL pages–try it!