Last week’s post looked at amino acid variation among avian BARCODEs (11,000 sequences, 2,700 bird species). The findings were that common variants (present in >0.1% of sequences) are few and restricted in terms of types of amino acid substitutions, while rare variants (present in <0.1% of sequences) are many and diverse, the latter consistent with our published observation (PLoS ONE 2012 e:43992) that most rare variants in this dataset are sequencing errors.
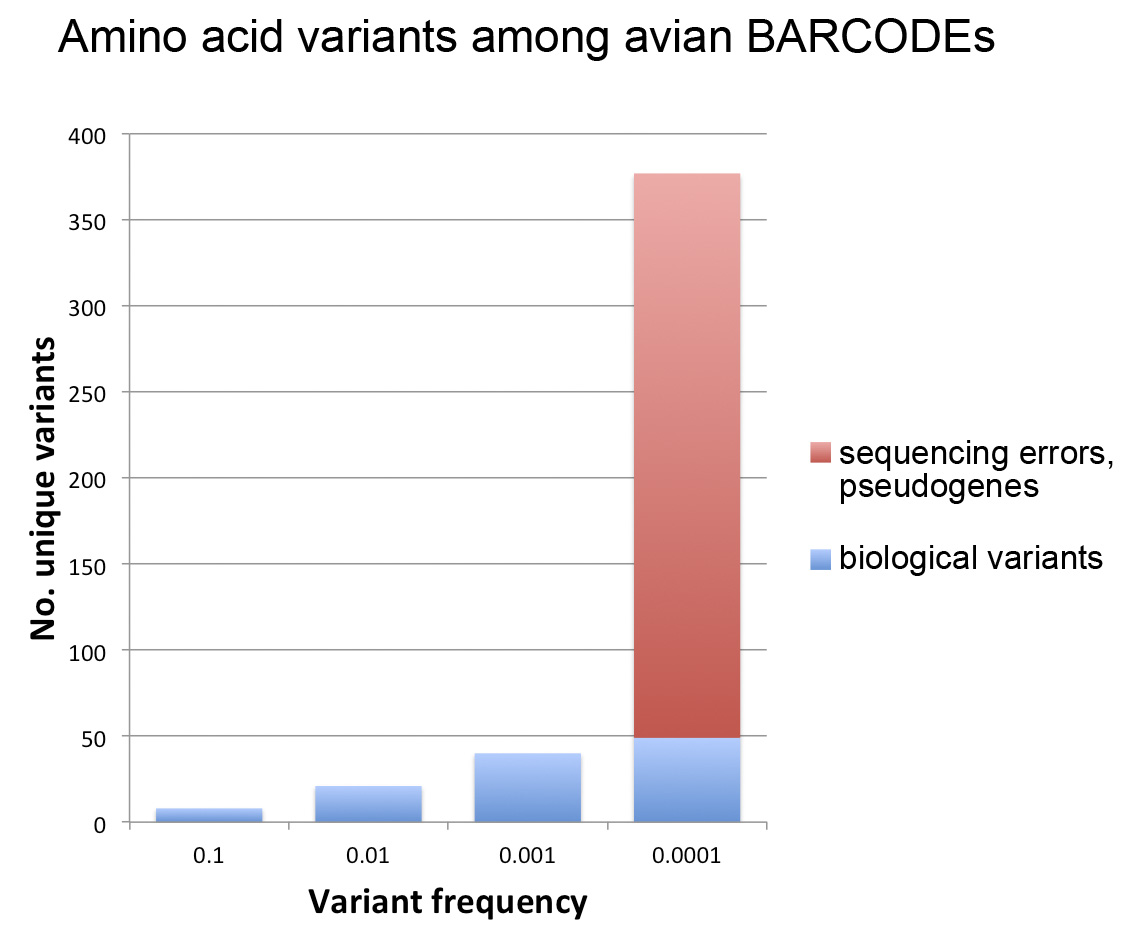
Here I follow-up on this observation to look more closely at the same dataset, this time asking what is the relationship between variant frequency and number? For this analysis I separated probable biological rare variants (found in 2 or more individuals of a species) from those that were likely sequencing errors or contained in pseudogenes (more details in PLoS ONE paper).
As shown in figure below, this analysis gave what looks like a surprisingly simple relationship between variant number and frequency, which presumably reflects some evolutionary principle assuming it is not an accidental feature of this particular dataset. It may be of interest to analyze amino acid variant frequency and number among BARCODE datasets from other taxonomic groups.
A larger version of this figure is available here.
