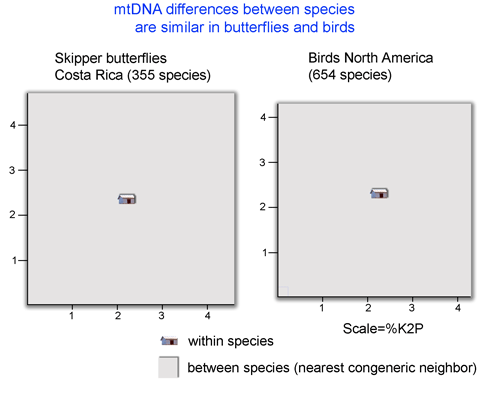
Most animal species correspond to tight clusters of mtDNA distinct from those closely-related species. In real estate terms, most species are small houses on big lots. Small houses because intraspecific variation in mtDNA is generally low, and big lots because distances between species are generally large.

Two recent posts looked at “house size”, or mtDNA distances within species. The finding of limited variation within most species calls out for research into mitochondrial genetics. Here I examine the other half of what species-level mtDNA maps show: “lot size”, or mtDNA distances between species. This refers to MINIMUM distances between species, ie the genetic distance between a species and its nearest neighbor on the mtDNA map. “Nearest neighbor” is more inclusive, and likely more appropriate for testing speciation/extinction models, than the subset of “sister species” which refers only to the most closely-related species pairs. Species without close relatives, and species whose closest relative belongs to another sister species pair are usually omitted from compilations of sister species.
It is long observed that distances between most animal species are larger than distances within (eg Moore 1995 Evolution 49:718). What is exciting is that there is now enough barcode data to allow scientifically interesting comparisons among groups. For example, the figure below shows average “lot size”, or minimum distance between species, is surprisingly similar in two large assemblages of butterflies and birds (nearest neighbor analysis performed using software and sequence data on Barcode of Life Data Systems (BOLD)).


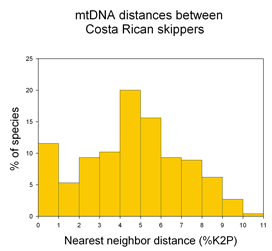
A potentially fruitful line of inquiry might be to examine nearest neighbor distances among allopatric vs. sympatric species. The distribution of nearest neighbor distances will likely be of interest to those studing birth and death of species (eg Nee 2001. Evolution 55:661). In the histogram of congeneric nearest neighbor distances among skipper butterflies shown at left, it is perhaps surprising the distribution is not a “hollow curve” (eg Scotland and Sanderson 2004. Science 303:643). Which models of speciation are consistent with observed distributions of genetic distances among species?