The festival in Washington DC celebrating the nature films of Jacques Perrin opened last night with an event highlighting Galatee’s new Oceans Project. We post Jesse’s Welcoming Remarks to Jacques Perrin.
Blog
Norway Convenes Barcoding Collections Symposium
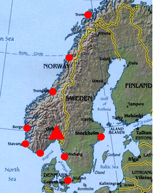
Representatives from 15 natural history museums and research institutions in Norway, Sweden, and Denmark gathered at Oslo Natural History Museum on 20-21 March 2006 to discuss the role genetic resource collections in the Barcoding of Life Initiative. Lutz Bachmann, Arild Johnsen, Jan T. Lifjeld, and Jon Lonnve organized an enjoyable and productive meeting, including many well-timed coffee breaks! There was general enthusiasm about museums joining in a collective effort, the public and scientific importance of genetic collections and natural history museums in understanding and preserving biodiversity, and the Barcoding of Life Initiative. As an initial step, the Natural History Museum in Oslo plans to barcode Norwegian birds, drawing on its 10,000+ samples of avian tissues. For more information contact Jan T. Lifjeld (j.t.lifjeld@nhm.uio.no).
Locations of natural history museums represented at Oslo meeting
DNA barcoding helps resolve tropical biodiversity
Tropical fauna challenge taxonomy because species richness is greater in the tropical than in temperate zones, most tropical species are as yet undescribed, and within-species genetic variation appears to be greater.
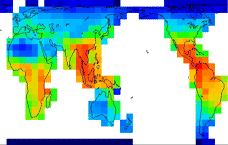
Land Animal and Plant Biodiversity World Map
Two recent papers show DNA barcoding aids species identification and discovery in tropical fauna. In January 24, 2006 Proceedings of the National Academy of Sciences USA, Hajibabaei et al examine 4260 specimens representing 521 (71%) of hesperiids (skipper butterflies), sphingids (sphinx moths), and saturniid moths of the of the ACG conservation area in Costa Rica. 510 (98%) of recognized species have distinct barcodes, 11 (2%) have barcodes that overlap with another closely-related species, and 13 recognized species have 2 or more distinct barcode clusters. Associated co-variation in habitat, food plant, and adult and caterpillar morphology indicate these clusters represent cryptic species, a total of 27 new species whose discovery was facilitated by barcoding.
In a similar vein, DNA barcoding revealed cryptic species with unsuspected host-specificity in a genus of presumed generalist tropical parasitoid tachinid flies. Insect parasitoids are a major cause of natural insect mortality and are used as biological control agents. They are thought to represent 8%-25% of all insect species, but understanding species richness and biology is hampered by the very large number of morphologically similar species. A published commentary by Herre emphasizes “…the value of DNA barcoding in uncovering hidden diversity…especially when coupled with traditional taxonomy and a keen appreciation of the fascinating details of basic natural history.”
All Birds Barcoding Initiative (ABBI) flight update
Bird barcodes fly in. So far, researchers have deposited 3308 avian COI barcodes from about 800 species, which represents 8% of world birds, to the Barcode of Life Database (BOLD) www.barcodinglife.org. Sequences from outside North America are flocking in, including a recent set from western Australian parrots, contributed by Peter Spencer, Murdoch University. Quoting P. Spencer “these species are generally high profile, expensive (some >AUD50K) and charismatic (aka people like to steal and display them!).” The barcode database may assist with wildlife forensics in preventing illegal taking and export.
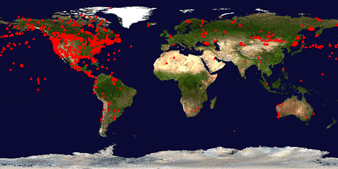
ABBI on tour, internationally. A 2 day meeting “Museum Collections and the Barcoding of Life” will be held at the Oslo Natural History Museum on March 20-21, 2006, and is heavily oversubscribed! ABBI-related presentations include talks by Per Ericson, Swedish Museum of Natural History; Jon Fjeldsa, Zoological Museum, Copenhagen; Arild Johnsen, Oslo Natural History Museum; and myself.
On April 7-8, 2006, a Consortium for the Barcode of Life (CBOL) meeting will be held in Capetown, South Africa. David Schindel, Executive Secretary of CBOL, will present a summary of ABBI progress and plans.
A workshop on “DNA barcoding of Palearctic bird species at Naturalis” will be held at National Museum of Natural History, Leiden, on 20-21 April 2006, organized by Per Ericson, Swedish Museum of Natural History. There may be additional space; if interested, please contact Per Ericson Per.Ericson@nrm.se
Where is that barcoder? An excellent site with remarkable photos of pelagic birds www.oceanwanderers.com/, sometimes features ID puzzles, such as this unidentified petrel that landed on a cruise ship coming into Hawaii. Despite being held and photographed, its identify remains uncertain. A single breast feather collected before releasing and we might know the answer!
Comparing barcoding performance
Suggested metric, terminology, and standard graphic
How well do barcodes distinguish among species? A standardized, simple quantitative method and terminology for comparing barcoding performance among different data sets will be helpful.
In trying to answer this question, I aim to promote terminology that does not include “error”. In my view, it generally does not make sense to talk about the error rate of barcoding. Barcoding is an instrument akin to a telescope, except that it is designed to resolve species, not stars. A telescope that does not resolve a double star is not wrong, it simply lacks sufficient resolution. Also, the term error rate implies there is an accurate reference standard in species identification. As systematists emphasize, species definitions are hypotheses and frequently undergo revision. Thus in this view barcoding performance, effectiveness, and resolution are useful descriptive terms and are more informative than barcoding error rate.
What we want is an approach that quantitatively compares barcoding with current taxonomy. In the future, taxonomy may incorporate some of the groups discovered through barcoding as recognized species, perhaps will combine some of the recognized species with overlapping barcodes into single species, and additional sequence data may enable resolution of species with overlapping barcodes. To start, a 2 x 2 table comparing recognized species to distinct barcode groups:
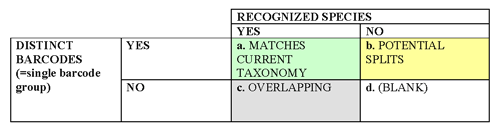
Suggested terminology:
Barcode group (or cluster): the shallowest branch in a neighbor-joining tree that corresponds to one or more recognized species or potential split within a recognized species.
Distinct barcodes: a barcode group that corresponds to a recognized species or a potential split within a recognized species. This definition can incorporate whatever criteria are used for recognizing splits (such as criteria that have been used to define provisional species, ESUs).
Barcode resolution: #barcode groups/total #species, in which total #species includes recognized species plus provisional species/ESUs.
This definition of barcode resolution incorporates “partially-resolved” species, so that if, for example, 8 species are resolved into 4 barcode groups, then resolution for that set would be 4/8 = 50%. Alternatively, if idea of partial resolution is not helpful, resolution could be defined more simply as a + b (green + yellow)/total #species.
Suggested graphic: Applying this to recent barcode data sets:
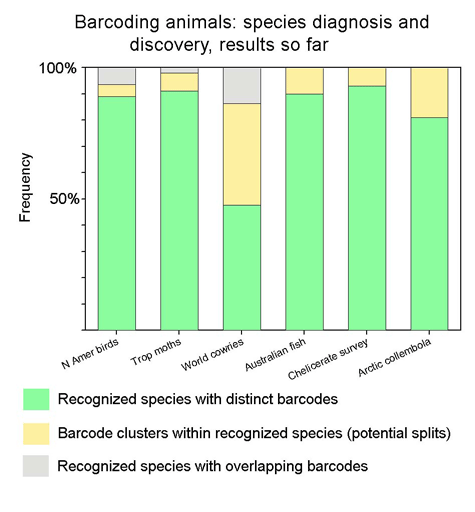
Suggested color scheme: As in table, green (=good!) matches current taxonomy; yellow represents novel species/provisional species/ESUs (yellow like an early bud that lacks chlorophyll), and gray (as in a gray indeterminate zone) represents recognized species with overlapping barcodes. By definition, all potential splits/ESUs have distinct barcodes, so d) in the 2 x 2 table is blank. As barcode findings are incorporated into taxonomy, I expect that the proportion that is green will increase—the greening of barcoding and taxonomy!
Mark Stoeckle
China’s 2nd MagLev
China confirmed its leadership in new transport technology with an announcement 13 March 2006 that it will build the world’s 2nd commercial maglev between Shanghai and Hangzhou, 175 km apart. The round trip will take less than 1 hour, fitting the journey into the human daily travel time budget and assuring massive traffic, as we explain in our papers Toward Green Mobility and The Evolution of Transport.
CoML update
Superb stories on the Census of Marine Life appeared 13 February in the leading German weekly, Der Spiegel, and 22 February in the leading Brazilian weekly, Veja.
Jesse NYTimes Global Warming
On 14 March Jesse will particiapte in a seminar organized by the New York Times about climate change.
Claire William’s Book
Claire Williams’ book Landscapes, Genomics, and Transgenic Conifers to which we contributed “Foresters and DNA†is now available from Amazon where the site features our opening sentence: “The decoding of DNA messages produces magnificent structures, perhaps none more magnificent than a tree…”
Viagra and Traditional Chinese Medicine
Always alert for surprising ways that technology may spare environment, we are delighted by papers showing that Viagra could spare threatened species in general and in particular ones exploited in traditional Chinese medicine. Better Viagra than Tiger Bone or Rhino Horn, as Richard Ellis has written.