The Barcode Blog

A mostly scientific blog about short DNA sequences for species identification and discovery. I encourage your commentary. -- Mark Stoeckle

Subscribe to this blog

Sign up for email notifications

Archive for the 'General' Category

Neotropical birds: Argentine researchers speed past halfway point

Thursday, October 11th, 2007

The Neotropics, comprising southern Mexico, Central America, Caribbean, and South America, is home to over 4,000 bird species, representing over 40% of world birds. In this post, Pablo Tubaro, Museo Argentino de Ciencias Naturales (MACN), Buenos Aires, Argentina, sends this update on DNA barcoding birds of Argentina:

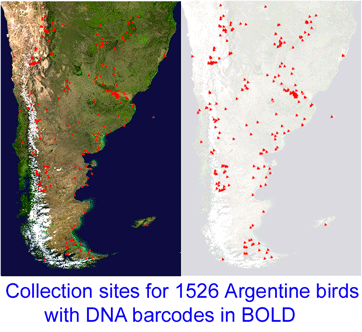
“This project, which started in December 2005, is a collaboration between MACN and the Biodiversity Insitute of Ontario/Canadian Center for DNA Barcoding (BIO/CCDB). In November 2006 the project was boosted by a grant from the Richard Lounsbery Foundation that supports expanded collecting efforts in Argentina, training of Argentine students at CCDB (2 trained so far), and establishment of a DNA laboratory at MACN. 

A special feature of this project is that it started literally from scratch. As there were no significant collections of frozen bird tissues with associated vouchers in Argentina, we started by resampling the country from north to south, conducting joint campaigns in collaboration with researchers from several North American institutions including American Museum of Natural History, Cornell University, Louisiana State University, Queen’s University, University of Alaska, and University of Kansas. At present our frozen tissue collection with associated vouchers includes more than 3100 samples and is growing rapidly. We will be doing field work at Iguazu National Park in November and December and aim to have collected 70% of Argentine birds by the year’s end.

Results so far show interspecific and intraspecific levels of divergence in COI squence are similar to published results with North American birds. In more than 98% of cases, the COI sequences belonging to different species do not overlap. In addition, in 3% of cases Argentine birds show distinct COI sequence clusters, suggesting the possible existence of cryptic species or geographical races that deserve species status. At this moment, four doctoral and post-doctoral fellowships have been requested or are already awarded by the National Research Council of Argentina (CONICET) and the National Science Foundation of Argentina (ANPCyT) to study in depth the phylogeographic structure of some of the interesting cases revealed by our DNA barcode survey.”

Congratulations to Pablo Tubaro and his team on their rapid progress in DNA barcoding Argentine birds, creation of a significant avian tissue and skin collection at MACN, and on recognition of the value of this work by science institutions in Argentina!
 

Taxonomy without borders

Friday, September 28th, 2007

341 researchers from 44 countries gathered for the Second International Barcode of Life Conference, held at Academia Sinica, Tapei, Taiwan on 17-21 September 2007 (program, participants, and abstracts at www.dnabarcodes2007.org).

Conference presentations highlighted a thrilling array of progress on diverse scientific and practical fronts since the First International Barcode of Life at The Natural History Museum, London, in February 2005 (London Conference proceedings in themed issue Phil Trans R Soc 360: 2005 available through Consortium for Barcode of Life (CBOL) website.  I found the Tapei conference to be a landmark demonstration of the value to society and science of a standardized, inexpensive approach to identifying species through DNA, ie DNA barcoding.  The Economist’s 20 September 2007 piece “Name, rank, and serial number” recaps results so far and looks ahead to near future societal benefits.  

Near the close of the conference, David Schindel, Executive Secretary for CBOL, referred to the DNA barcode initiative as “taxonomy without borders”. Just as removing security fences benefits African wildlife, standardized inexpensive technology for species identification, ie DNA barcoding, is helping remove barriers that balkanize taxonomy and limit public access to biological knowlege. The DNA barcode initiative, together with the Encyclopedia of Life which includes digitizing the world’s taxonomic literature are creating powerful new ways of seeing biodiversity, with benefits to society and science. 

I look forward to a future in which the multiple sectors of taxonomic and biodiversity science are densely linked to each other and public users.  

Adapted from Valdis Krebs, Emergent Online Community

Exploring mitochondrial DNA differences within species

Thursday, September 13th, 2007

Paul De Barro, CSIRO, Australia, recently posed the question “What is the expected level of mitochondrial variation within species?” The answer may be “almost none”. Results so far with DNA barcoding initiatives show average intraspecific variation in most animal species, whether saturniid moths or sand martins, is on the order of 0.5% or less. Here is my somewhat speculative set of inferences drawn from the finding of low variation within most animal species:

from Joron, Mallet TREE 13:461, 19981. Low intraspecific variation implies low effective population size (Ne); according to my back-of-the-envelope math, about 10,000 or so for most animal species. The apparent ceiling on Ne is low enough that census population size and species age, both of which might be expected to be determinants, do not contribute to intraspecific variation.

2. What about species with larger average differences in mitochondrial DNA? Most are mosaics of reproductively-isolated or partially reproductively-isolated populations, some of which might be considered separate species. According to standard models of sequence evolution, it takes tens of thousands of years of reproductive isolation for distinct lineages of mitochondrial DNA to arise; significant morphological, ecological, and behavioral differences considered characteristic of separate species may arise over that length of time as well. 

3. The paradoxical observation of large differences between species (indicating steady change) and small differences within (indicating change is constrained) implies that the pool of variants within a species changes steadily over evolutionary time scales. Like influenza virus, which regularly produces new variants that replace last year’s strains, the DNA sequences within breeding populations are continuously evolving, so that reproductive isolation over a sufficient period of time inevitably leads to genetic divergence. There may be morphologic stasis but there is no genetic stasis.

4. The usual absence of multiple lineages (with say >1% divergence in coding mtDNA) within breeding populations implies selection against hybrids and their offspring.  

Now for some complex real data that challenge this simple model! In Proc R Soc B August 2007, researchers report on “Limited performance of DNA barcoding in a diverse community of tropical butterflies”. Elias and colleagues examined COI barcode region mtDNA sequences in 353 specimens from 57 species of ithomiine butterflies, most from 2 study sites in eastern Ecuador. Ithomiines are a tropical subfamily of approximately 360 species, virtually all of which are part of dizzyingly complex “rings” of Mullerian mimicry (all species distasteful) in which multiple species, some only distantly related, have nearly identical morpholgy. There is often marked geographic variation within what are considered single species such that different regional forms participate in different rings. For more appreciation, there are gorgeously illustrated research and other sites on ithomiines and other Mullerian mimics. 

This exemplary study helps demonstrate the power of analyzing a standardized region, ie DNA barcoding, as their findings can be directly compared to results in other studies. In NJ analysis using the 273 study site specimens, the authors found that 44 of 57 (77%) of species formed well-supported (>50%) clusters. When sequences from non-local specimens were added to the analysis, and considering only species with more than one congener and with local and non-local sequences, 28 of 41 species (68%) formed distinct clusters. So one might mark down this group as challenging for DNA barcode approach to species identification.

One question is whether genetic diversity is more finely divided than current taxonomy recognizes. Differences within species sampled at distant geographic sites were as high as 8.5%, which the authors view as expected variation for tropical species with large census population sizes. Is this correct? Do larger populations support greater mitochondrial variation? According to report last year by Bazin et al Science 312:570 April 2006, the answer is no, but this conclusion seems not yet widely embraced.  Following Bazin et al and the model outlined above, I suggest the genetically divergent forms reflect reproductively isolated allopatric populations and some might turn out to represent different species. 

On the other end, some species had nearly identical COI sequences. Are these young species?  The authors helpfully analyzed nuclear gene EF-1 alpha for most specimens and state that the nuclear gene sequence improved species-level identifications compared to mtCOI. On my inspection the published tree shows a similar overlap of EF-1 alpha gene sequences, which together with COI data suggests these are very closely-related young species.  Recent work by some of the same authors Nature 441:868 14 June 2006 shows new species formation in just 3 generations in related Heliconidae butterflies through hybridization, so perhaps there are mechanisms that enable very rapid emergence of distinctive forms within these butterflies. There are presumably swarms of populations within many species that are distinctive in one form or another. 

As this study shows, comparing relative and absolute differences in a standardized gene region is a useful approach for exploring the genetics of biodiversity. DNA barcode data sets can help address the question of whether population size influences mitochondrial sequence variation, and in turn the answer will help in understanding the patterning of genetic diversity among and within species. I look forward to more data on ithomiines and their relatives! 

Scanning mosquito barcodes to help solve disease mystery

Sunday, September 2nd, 2007

What limits Japanese encephalitis virus (JEV) to its current range? JEV is a mosquito-transmitted flavivirus related to yellow fever and West Nile viruses that causes approximately 40,000 human cases annually in SE Asia. Although regular epidemics occur in islands off Papua New Guinea as close as 70 km to Australia and the major JEV vector in Papua New Guinea (PNG), Culex annulirostris, is found throughout Australia, there have only been sporadic cases in Australia and the disease has not become established there.

In 29 June 2007 BMC Evol Biol researchers analyzed mitochondrial COI and nuclear ITS 1 sequences in 273 mosquitos identified as Culex annulirostris or its close relatives Cx. palpalis and Cx. sitiens, collected at 30 locations in Australia and Papua New Guinea.  Hemmerter et al found that 10% of morphological identifications were incorrect, based on ITS 1 sequences, and there was “100% agreement between the ITS 1 diagnostic and the COI sequence grouping of Culex spp.” Bayesian phylogenetic trees with COI showed “distinct geographically-structured lineages” (ie possible cryptic species) within the vector species Culex annulirostris, and two of the four Cx. annulirostris lineages are restricted to PNG, with a southern limit at the top of Australia’s Cape York peninsula, “which correlates exactly with the current southern limit of JEV activity”.  Analysis of blood meals reveals the Australian Cx. annulirostris feed mainly on marsupials (PNG lineages feed on wild pigs which are the primary JEV reservoir), and laboratory studies indicate Australian Cx. annulirostris is an inefficient vector for JEV. As the authors note, it seems likely these genetically and biologically distinct lineages are likely different species.

One limitation of this study is that the COI region analyzed does not match the COI barcode region. By my analysis the 538-bp fragment analyzed in this study starts at position 359 in COI. As the defined COI barcode region is 648 bp starting at position 58, there is only 289 bp overlap between the sequences in this study and COI barcodes.  It appears generally straightforward to amplify COI barcodes from insects including mosquitos, so I hope the next study on genetic differences in human disease vectors will amplify the COI barcode region, as that will enable linking the results to the growing DNA barcode library, amplifying the power of the research itself. 

I conclude that routine application of standardized genetic testing, ie DNA barcoding, will help in understanding the distribution of mosquito biodiversity, with implications for human health.

Marine barcode of life initiative joins web panoply

Sunday, August 26th, 2007

In July 2007 the Marine Barcode of Life initiative (MarBOL) surfaced at www.marinebarcoding.org. MarBOL is “an international initiative to enhance our capacity to identify marine life by utilizing DNA barcoding”. It is an offspring of the Census of Marine Life (CoML), a ten-year initiative to assess and explain the diversity, distribution, and abundance of marine life in the oceans and the DNA barcode initiative.

The target list for MarBOL includes the diverse invertebrates that inhabit the oceans, as well as marine mammals, fish, and birds. MarBOL will be compiling barcodes collected through CoML projects, including those focused on marine zooplankton (CMarZ), pelagic animals (TOPP), nearshore environments (NaGISA), reefs (CReefs), continental shelves (COMARGE), seamounts (CenSeam), deep water vents (ChEss), abyssal plains (CeDAMar), Arctic Ocean (ArcOD), Antarctic Ocean (CAML), northern Mid-Atlantic ridge (MAR-ECO), Gulf of Maine (GoMA), northeastern Pacific continental shelf (POST), and perhaps even marine microbes (IcoMM)! The project will also utilize barcodes collected by ongoing barcoding initiatives on fish, birds, and sponges.

Part stands for the whole

Sunday, August 5th, 2007

A synecdoche is a figure of speech in which a part stands for the whole, or the whole stands for a part. Taking the first, we might consider a DNA barcode as a synecdoche, in which the short barcode gene fragment stands for whole genome. As in the figure, a COI barcode usually encapsulates the differences found elsewhere in the mitochondrial genome. Because COI barcodes generally capture the discontinuities we recognize as species, we can surmise that differences in this short mitochondrial gene fragment usually reflect differences in the nuclear genome. More study of variation within and among species will help understand why differences in mitochondrial and nuclear genomes appear inextricably linked. 

for larger version click here

DNA barcode helps describe new goby, a vertebrate first

Friday, August 3rd, 2007

In 12 July 2007 Zootaxa, Benjamin Victor, Ocean Science Foundation and Nova Southeastern University, describes a new species of goby Coryphopterus kuna from the western Caribbean. Although species descriptions often cite DNA sequence differences as evidence for species status, the sequence data itself is usually not shown. Victor’s work is the first vertebrate species description that includes the holotype mtCOI DNA barcode, a simple step that will enable more persons to identify this fish regardless of life stage (egg, larva, and adult forms of an individual all have the same DNA of course) or whether specimen is in bits and pieces, as in stomach contents of a predator for example.  (For a look at the strange diversity of fish larva, see Victor’s web-based photographic guide to larval fishes of the Caribbean).

The process that leads to taxonomic recognition of new species is often glacially slow. In this case the holotype specimen was collected off the coast of Panama in 1982, twenty-five years ago. Just as the Human Genome Project generated enormous amounts of raw sequence data, genetic explorations of biodiversity, including DNA barcoding, are creating vast amounts of data that outpace the ability of traditional species descriptions to keep up. Making the sequence and specimen data available through public databases in BOLD and GenBank might lead others to find to new ways of analyzing biodiversity in addition to the stately process of formal species descriptions.

DNA-assisted discovery of new leopard in Borneo worries some taxonomists

Tuesday, July 24th, 2007

Like a telescope that reveals hidden structures in the universe, genomic analysis is a window into biodiversity. For one, differences in DNA sequences help reveal how biodiversity is partitioned into the distinct populations we call species. In Frontiers Zool 29 May 2007, researchers from University of Wurzburg, US National Cancer Institute, and Arizona State University report on mitochondrial DNA and nuclear microsatellite differences between clouded leopards (Neofelis nebulosa) from Borneo (5 individuals), Sumatra (2 individuals), and mainland SE Asia (6 individuals). This report is a follow-up on two papers in December 2006 Current Biol which proposed separate species status for Bornean clouded leopards on the basis of differences in coat pattern and DNA. Wilting et al conclude their updated results “strongly support reclassification of clouded leopards into two distinct species N. nebulosa and N. diardi“. In addition to distinct coat patterns, the two lineages differ by 4.5% in mitochondrial coding genes (cytochrome b and ATPase-8), equivalent to or larger than genetic distances between the other well-recognized species of big cats in Panthera genus (lion, jaguar, tiger, leopard, snow leopard), suggesting the two lineages of clouded leopards have been separated for about 2.86 million years.

This sounds straightforward, but some taxonomists lament the increasing role of DNA in species discovery. In an editorial in current PLoS ONE, researchers from Imperial College insist the Bornean clouded leopard is not really new as it was “described by Cuvier in 1823.” Of course, by this criteria, most forms of larger animals will have been “described” by someone. Cuvier’s original work naming Felis diardi is three short paragraphs based on a single specimen and the illustration is unrecognizable.  


To my reading, Meiri and Mace’s editorial implies that most of the important taxonomic work has already been done and if new genetic data appear to upset the traditional scheme, then it is being incorrectly interpreted. They note that there are another 144 mammal species shared between Borneo and the Malay Peninsula, thus “there could potentially be equivalent evidence to merit specific status for all of these; an outcome that would surely be unjustified”.  An outcome that would surely be unjustified? This question needs to be answered by science, not by an appeal to taxonomic tradition. It may be that many island populations, which are now considered allopatric forms of widely distributed species, will turn out to be distinct species.

I close with the observation that just as genetic data can suggest splits it can also help reveal synonomies (multiple names that refer to the same species), suggest lumps, and identify forms that do NOT merit separate conservation status. For example, in Proc R Soc B 2005 Johnson et al apply mitochondrial DNA analysis to argue that the Cape Verde kite is not genetically distinct from the Black kite Milvus migrans and does not merit separate conservation status. 

Mapping routes for DNA barcoding land plants

Thursday, July 19th, 2007

Progressive GardensLand plants challenge standardized DNA-based identification. Different groups of land plants are deeply divergent at the DNA level, yet there are relatively few sequence differences among closely-related species. Deep divergences make it difficult to design broad-range primers that amplify DNA from the many kinds of plants, and small differences among closely-related species mean longer sequences are needed to distinguish them. Plant mitochondrial genes including COI evolve too slowly to be useful. The best strategy appears likely to be a combination of 2 or 3 gene regions from the chloroplast genome. Chloroplasts are organelles which house the plants’ photosynthetic machinery and have their own genome, like mitochondria.

In May 2007 Taxon, 19 researchers from 12 institutions in 7 countries (Brazil, Colombia, Denmark, Mexico, South Africa, U.K. and U.S.A.) report on tests of candidate barcode regions. Chase and co-investigators outline the rationale and results for selecting and testing potential land plant barcode regions. The finalists were winnowed down from more than 100 coding and non-coding regions in chloroplast DNA by testing 96 pairs of closely-related plant species to see which regions could be amplified and provide discrimination. Although the actual data are not shown in this short update, they summarize their results by proposing three chloroplast gene regions as a standard barcode for land plants: two coding regions, matK and rpoC1, and, either a third coding region, rpoB, or the non-coding psbA-trnH spacer region.

In June 2007 PLoS ONE, Kress and Erikcson, Smithsonian Institution, examine nine potential loci (8 plastid regions which includes the four final candidates in the Taxon paper, and nuclear gene ITS). In this analysis, as in Chase et al report, there are two steps: first, does the region amplify with a standard set of primers, and second, if so, does the sequence enable discrimination of closely-related species. In the 48 pairs of species examined, only two loci, trnH-psbA and rbcL-a exhibited more than 90% success with standard primers.  Based on this admittedly small sample, the authors propose a “two-locus global DNA barcode for land plants” in which “rbcL-a provides a strong recognition anchor that will place an unidentified specimen into a family, genus, and sometimes species; the highly variable trnH-psbA spacer will futher narrow the corrrect species identification where rbcL-a lacks discrimination power.”

These are promising starts towards a standardized DNA barcode for land plants. More tests are needed, including analysis of variation within species, as both studies used single specimens for each target species.

Standardized mtDNA analysis to help identify exotic wildlife

Tuesday, July 10th, 2007

Many exotic pets are also endangered or threatened species.  Global illegal trade in protected wildlife is estimated at $10 billion annually.  The essential first step in international wildlife law enforcement is accurate species identification. In April 2007 Conservation Genetics researchers from Trent University, Ontario, and Toronto Zoo apply DNA barcoding to species identification of genus Brachypelma tarantulas from Mexico. “Brachypelma…tarantulas are popular pets as they are long-lived [15-25 years], brightly-colored, and tend to be docile…leading to over-harvesting from the wild.” Petersen and colleagues developed a method for recovering DNA from shed exoskeletons (exuviae), an improvement over the usual practice for DNA study of live tarantulas of “inducing limb autotomy” ie removing a leg!  Short COI sequences (205 bp) from 23 individuals representing 8 of the 20 known Brachypelma species were analyzed. Even with this short sequence, all species formed well-supported nodes in a NJ tree (tree topology recovered with maximum parsimony and maximum likelihood methods was consistent with NJ results).  The authors call for a “reference set of COI barcodes…fully vouchered and accessioned into a recognized collection”. They conclude that analyzing DNA from exuvia will enable field researchers to “sample individuals in situ without reducing the fitness of animals or reducing the population size” and aid in conservation of these iconic species and their habitats. 


Contact: mark.stoeckle@rockefeller.edu

About this site

This web site is an outgrowth of the Taxonomy, DNA, and Barcode of Life meeting held at Banbury Center, Cold Spring Harbor Laboratory, September 9-12, 2003. It is designed and managed by Mark Stoeckle, Perrin Meyer, and Jason Yung at the Program for the Human Environment (PHE) at The Rockefeller University.

About the Program for the Human Environment

The involvement of the Program for the Human Environment in DNA barcoding dates to Jesse Ausubel's attendance in February 2002 at a conference in Nova Scotia organized by the Canadian Center for Marine Biodiversity. At the conference, Paul Hebert presented for the first time his concept of large-scale DNA barcoding for species identification. Impressed by the potential for this technology to address difficult challenges in the Census of Marine Life, Jesse agreed with Paul on encouraging a conference to explore the contribution taxonomy and DNA could make to the Census as well as other large-scale terrestrial efforts. In his capacity as a Program Director of the Sloan Foundation, Jesse turned to the Banbury Conference Center of Cold Spring Harbor Laboratory, whose leader Jan Witkowski prepared a strong proposal to explore both the scientific reliability of barcoding and the processes that might bring it to broad application. Concurrently, PHE researcher Mark Stoeckle began to work with the Hebert lab on analytic studies of barcoding in birds. Our involvement in barcoding now takes 3 forms: assisting the organizational development of the Consortium for the Barcode of Life and the Barcode of Life Initiative; contributing to the scientific development of the field, especially by studies in birds, and contributing to public understanding of the science and technology of barcoding and its applications through improved visualization techniques and preparation of brochures and other broadly accessible means, including this website. While the Sloan Foundation continues to support CBOL through a grant to the Smithsonian Institution, it does not provide financial support for barcoding research itself or support to the PHE for its research in this field.