The Barcode Blog

A mostly scientific blog about short DNA sequences for species identification and discovery. I encourage your commentary. -- Mark Stoeckle

Subscribe to this blog

Sign up for email notifications

Archive for the 'General' Category

CSI for fish: High school students help showcase ease of DNA-based species identification

Tuesday, August 26th, 2008
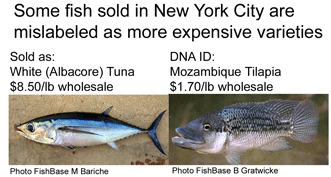
In Pacific Fishing September 2008 (issue available on newstands, not yet on web) two New York City teenagers, Kate Stoeckle (my daughter!), 19, and classmate Louisa Strauss, 18, apply DNA-based identification to fish sold in their Manhattan neighborhood. The girls purchased 60 items from 14 establishments and sent samples to University of Guelph where graduate student Eugene Wong performed DNA barcode analysis. 14 (25%) of 56 samples with recoverable DNA were mislabeled, in all cases as more expensive or more desirable fish. Mislabeled items were sold at 2 of 4 restaurants and 6 of 10 grocery stores/fish markets. 

The frequency of mislabeling and the ease of high-schoolers obtaining DNA-based species identifications captured public interest. Their study was featured on page 1 in New York Times on August 22, one of the “quotes of the day” on CNN/Time website, a live segment on CBS TV Early Show, an interview on national public radio, and has appeared in over 350 print and news items and blogs from 34 countries in 10 languages so far, with particularly heavy coverage in China, Korea, and Japan, presumably related to dietary importance of fish in general and sushi in particular. 

This response demonstrates how powerful the FishBOL database is already (30,665 barcodes from 5,463 species so far, which represents about 20% of world fish), and hints at enormous uses that DNA barcoding will have as technology gets smaller and cheaper.
Summer hiatus

Monday, July 28th, 2008

I will be away from Blog until mid-August.


Helping reveal relationships among species

Sunday, July 27th, 2008

COI barcodes aim to enable identification of species, assigning unknown specimens to known species, and helping flag genetically divergent organisms that may represent new species. Might barcodes also help understand relationships among species?

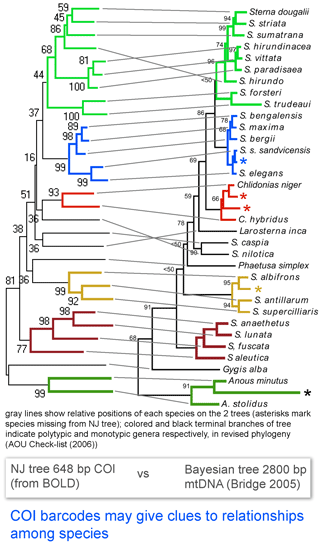
Here I look at one example from birds, comparing differences among COI barcodes to a recently revised phylogeny of terns (subfamily Sternini). According to American Ornithologists’ Union Check-list of North American Birds Supplement 47 (2006), “the data show that the genus Sterna as currently defined…is paraphyletic.”…”[W]e follow the recommendation of Bridge et al 2005 to resurrect four generic names currently placed in synonomy with Sterna.” The figure at left, taken from the 2005 paper by Bridge, Jones, and Baker, shows phylogenetic relationships based on 2800 bp of mtDNA from 33 species of terns (Bayesian tree with ML distances and ML boostrap support indices), and is juxtaposed to an NJ tree of COI barcodes from 29 of the same 33 taxa. The figure is colored according to the revised generic assignments (AOU 2006).

The topology of the COI NJ tree is similar to the larger data set tree, including that all currently recognized genera are reciprocally monophyletic, and most show similarly high boostrap values as in the Bayesian/ML analysis based on the larger data set. 

Of course mitochondrial DNA is widely used in analyzing relationships among animal species, including birds. Most of these studies are focused on relatively small groups of species, such as the tern study cited here. With growing DNA barcode libraries it will be increasingly possible to get at least a preliminary look at genetic relationships for large numbers of species (so far 2,393 avian species (24% of world birds) have barcode records in BOLD). This could be exciting! 

Mitochondrial DNA’s unique power

Sunday, July 20th, 2008

The DNA barcode for animals is a 648 base pair (bp) fragment from the 5′ end of mitochondrial gene cytochrome c oxidase subunit I (COI).  Does this relatively short mitochondrial sequence contain enough information to make evolutionary inferences about species limits, or is it a more of a rough survey method that needs to be confirmed by more data including from nuclear genes? 

In April 2008 Mol Ecol researchers from University of Minnesota and American Museum of Natural History, New York, analyze utility of mitochondrial as compared to nuclear DNA for inferring recent evolutionary history. Zink and Barrowclough first apply population genetic theory and then look at real data from bird species. 

Based on mathematical population genetics, they find “mitochondrial loci are generally a more sensitive indicator of population structure than are nuclear loci,” primarily due to much smaller effective population size (Ne) for mitochondrial as compared to nuclear markers, which leads to more rapid sorting of differences among genetically isolated populations. Analysis of real-world data in 45 studies of differences among and within avian species confirms this expectation, ie either the patterning is consistent between mitochondrial and nuclear genes, or there are shallow mtDNA trees which are not yet reflected in nuclear genes. Reanalysis of one study, which appears to show a split in nuclear but not mitochondrial markers, suggests possible misinterpretation. Regarding other factors that could potentially lead to mistaken inferences about species limits based on mitochondrial DNA (NUMTs, sex-biased gene flow, introgression), experimental data suggests these are rarely important, at least in birds. The authors conclude “mtDNA patterns will prove to be robust indicators of population history and species limits.” Nuclear markers ARE important for deep gene trees, for detecting hybrids, and for “quantitative estimates…of rates of population growth and values of gene flow.”  

Regarding length of mitochondrial sequence, this only has to be long enough to capture differences among closely-related species. Most populations that we recognize as species differ from their closest relatives by >1% in mitochondrial coding regions (corresponding to about 0.5 million years or more of reproductive isolation). At this level, even 100 bp is generally sufficient to distinguish most closely-related species, and a 648 bp COI barcode sequence should generally allow resolution of populations/species which have been reproductively isolated for much shorter periods of time. 

Identifying the unidentifiable

Sunday, July 13th, 2008

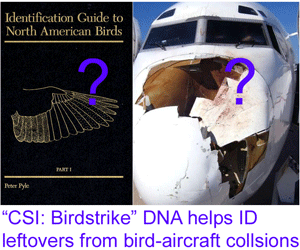
In July 2008 Wildlife Management researchers from Smithsonian Institution report on identifying otherwise unidentifiable remnants from bird-aircraft collisions (hereafter birdstrikes). Authors Dove et al point out “birdstrikes are a serious safety hazard and a major expense for the industry”. The US Federal Aviation Agency Wildlife Mitigation site shows about 600 incidents a month over the past year, peaking in late summer and early fall, presumably coincident with fall migration. The Smithsonian Institution has been identifying birdstrike species for military and civil aviation industries since the 1960s, analyzing specimens which range from whole carcasses to bits of feathers, tissue, or blood. Prior to availability DNA testing, identifications have relied on expert examination of detailed feather morphology with comparisons to Smithsonian’s vast bird specimen collection.

Of 1,715 birdstrike samples sent to Smithsonian Insitution during 4 months in fall 2006, 821(47.9%) contained only blood or tissue. Of these, 554 (67.5%) had amplifiable mtCOI DNA, and 535 (96.6%) with DNA led to species-level identifications based on reference sequences in Barcode of Life Database (BOLD). DNA barcoding identified 128 species representing 14 orders of birds, plus 2 bat species. 19 cases were deemed inconclusive as DNA barcode matched to a set of 2 or more closely-related species with overlapping barcodes, or the recovered sequence did not meet their 98% match criteria when compared to BOLD.

There was much better success recovering DNA from dry samples (70%) than from samples collected with a wet paper towel (about 23%), which had been the standard method, pointing the way toward improving yield of DNA-based ID. The authors conclude with a call for applying “a combination of morphological and molecular methods such as DNA barcoding for efficient, cost-effective birdstrike identifications”.

Just as in CSI television series, DNA-based identification can make possible what would otherwise be impossible; in this case, identifying birds from bits of tissue and blood and making birdstrike identifications available to those without access to Smithsonian’s experts or vast collections. In addition to helping airlines, birdstrike ID will inform our knowledge of bird migration routes. There are many exciting discoveries ahead.

DNA identifies invasive parasitic wasp

Monday, July 7th, 2008

Like the creatures Sigourney Weaver battles in Alien, parasitoids are organisms whose larva develop in other species, usually leading to the death of the host. Insect parasitoids are widely used as biological control agents; sometimes these efforts go awry, threatening non-pest species in local ecosystems. Widespread introduction of tachnid fly parasitoid Compsilura concinnata has failed to control Gyspy moth Lymantra dispar outbreaks in eastern US, but has led to dramatic declines in large, showy Silk moths including the beautiful Luna moth Actias luna (Elkinton and Boettler. 2004). 

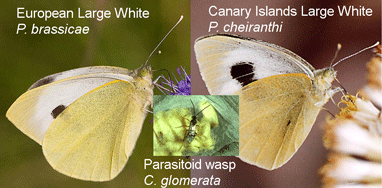
About 10% of named insect species are parasitoids, mostly wasps, but recognizing these often minute insects can be tricky. In November 2007 Conservation Genetics researchers from Czech Academy of Sciences and University of South Bohemia, Czech Republic; Natural History Museum, London; and Imperial College London apply COI DNA sequencing to identify wasps parasitizing Canary Islands Large White butterfly Pieris cheiranthi, which is restricted to local endemic ecosystem of relict laurel forests. Lozan et al reared 55 P. cheiranthi caterpillars from 2 Canary Island sites, and found half of the larva from forest margin and none from central forest were parasitized with what appeared to be Cotesia glomerata, native to Europe and introduced elsewhere as biocontrol agent although not in Canary Islands. 
3 of 600 C. glomerata-like adult wasps reared from Canary Island White larvae and 2 of 700 C. glomerata reared in Czech Republic from European Large White P. brassicae larvae were analyzed and found to have identical 5′ COI DNA sequences (this is the same region selected as a DNA barcode for animals). The authors conclude that European C. glomerata has been accidentally introduced to Canary Islands and is threatening a local endemic butterfly already under pressure from habitat loss. Without mentioning DNA barcoding by name, the authors conclude with a call for “increased effort to sequence morphological Costesia spp. from a broad geographical range…enabling the regular testing of species hypotheses…and the incorporation of all life stages using a single character set”. I hope that the authors can join forces and enable their sequences and associated metadata (eg collection location, specimen photographs, voucher information) from this and future Cotesia spp work to be usefully combined with growing COI barcode database (>415,000 COI barcode records from >41,000 species in BOLD so far, including 514 records from 89 named and provisional Cotesia spp). Looking ahead, routine application of DNA-based identification to parasitoids will help establish host ranges of potential biocontrol agents and detect inadvertent introduction of broad-range parasitoids that damage local ecosystems.

Freshwater fish DNA data debut

Sunday, June 22nd, 2008

In June 2008 PLoS ONE, thirteen researchers from nine Canadian universities, museums, and federal agencies report on mtDNA sequences from 1360 individuals representing 195 (95%) of Canada’s 205 freshwater fish species. Hubert et al follow “best practices” established for DNA barcode records (similar criteria would enhance the value of other genetic reference data as well), namely each sequence is derived from a vouchered specimen and the barcode record includes:

  • “Bi-directional sequences of at least 500 base-pairs from the approved barcode region of COI, containing no ambiguous sites
  • Links to electropherogram trace files available in the NCBI Trace Archive
  • Sequences for the forward and reverse PCR amplification
  • Species names that refer to documented names in a taxonomic publication or other documentation of the species concept used
  • Links to voucher specimens using the approved format of institutional acronym:collection code:catalog ID number”

The researchers analyzed an average of 7.6 specimens/species, with an effort to sample across species ranges. A first pass look at genetic distances among and within Canadian freshwater fish shows results similar to those of other animal groups: average variation within species, 0.3%; average minimum distance between congeneric species (nearest neighbor), 8.3%; species with overlapping mtDNA sequences, 7% (4 species pairs and 1 flock of 5 species; one of the overlapping species pairs represents probable introgression. ) Five species showed divergent clusters differing by 1-2% in different parts of their geographic ranges, and 2 species showed larger divergences (3%, 7%); some or all of these might represent distinct species. 

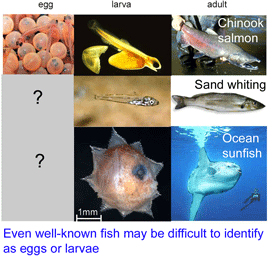
A challenge for science publishing is disseminating the large data sets that are increasingly generated. Restricting publication to only those studies with novel findings can lead to a kind of distortion, sometimes with serious consequences. The bias against negative studies, for example, is one factor contributing to the misculation of risks of medicines. As biodiversity genetics moves forward, we need ways to ensure high-quality work, receive appropriate academic credit, and disseminate results in a timely manner.  PLoS ONE describes itself as “an international, peer-reviewed, open-access, online publication…that welcomes reports on primary research from any scientific discipline.” It seems to me that this sort of forum with a focus on quality rather than novelty is needed as a home for publication of large genetic data sets including DNA barcode records. Making this information available in a timely manner will in turn help drive development of analytic and display tools and enable scientific applications, such as identification of fish eggs and larva shown above. 

DNA helps sort out really big animals, crowding Ark

Friday, June 13th, 2008

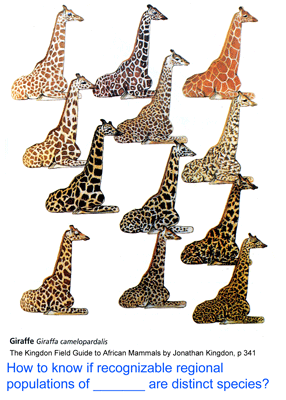
How many giraffes were onboard the Ark?  Giraffes are classified as a single species, Giraffa camelopardalis, with five to nine subspecies proposed based on regional variation in pelage (coat pattern). In 21 dec 2007 BMC Biology (open access) researchers from University of California, Los Angeles; Center for Conservation Research, Omaha Zoo; and Mpala Research Centre, Kenya, investigate genetic variation in giraffes across African continent. 
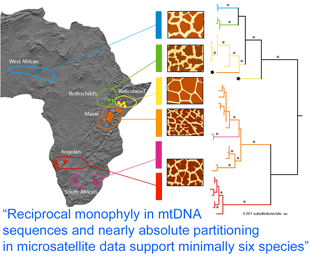
Using biopsy darts, the authors collected skin specimens from 266 giraffes at 19 localities in West, East, and South Africa. A 654 nucleotide region of mtDNA spanning cytb and control sequences was analyzed, revealing 35 haplotypes, and the remainder of the cytb gene (1709 bp total) was sequenced from one individual from each of the 35 haplotypes. The mtDNA sequences clustered into six reciprocally monophyletic lineages, which corresponded to groupings according to pelage pattern and regional location, and were largely concordant with subspecies designations.  Genetic distances suggested these groups have been reproductively isolated for 0.3 to 1.6 MY, similar to calculated divergence times among other closely-related mammals.

Analysis of 14 nuclear microsatellites from 381 individuals at 18 locations (it is not clear whether these are the same individuals as above) recovered the same six groups and suggested additional genetic subdivisions within some groups. Although at least some of the genetically and pelage-defined clusters have overlapping or adjacent ranges without geographic barriers, only three (0.8%) of individuals were identified as hybrids. These findings raise interesting questions about giraffe biology; for example, is there behavioral isolation perhaps based on visual recognition of pelage patterns? 
It is impressive that species can be overlooked in such large, boldly patterned, iconic animals.  Might there be similar divisions within the numerous species of small, brown, rarely seen mammals? Routine DNA analysis of a standardized mtDNA region (aka DNA barcoding) will help discover how finely divided animal biodiversity is.  Wilson and Reeder’s Mammal Species of the World, Third Edition lists 5,419 species, so this appears to be an achievable goal for our mammalian kin (list available online https://nmnhgoph.si.edu/msw/).  I hope the authors include barcode region COI in their next analyses, so their data can be easily combined with other data sets, including the 28,560 mammalian barcode records in BOLD to date. 

High school students help demonstrate practicality, utility of DNA barcoding

Wednesday, June 4th, 2008

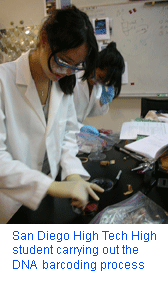
High school students in San Diego are using DNA barcoding to survey life in San Diego Bay, ranging from invasive mussels, to gastropod egg masses on eel grass, zooplankton and endangered species. Under leadership of Dr. Jay Vavra, students developed a simplified protocol for DNA extraction and amplification that can be performed in the high school’s biotechnology laboratory, and successfully identified dried jerky meat from ostrich, turkey, and beef. They have established a collaboration with East African graduate students to apply this approach to identifying bushmeat from endangered species in local African markets.

Just two years ago, in Syst Biol 55: 844, 2006 some taxonomists worried whether DNA barcoding would ever be useful: “The truth is that DNA barcoding will not have any meaningful use for the general public and even when a portable barcoder becomes available it will not lead to any increase in the biological literacy of the man in the street.” Authors Cameron et al might want to visit their local high school!

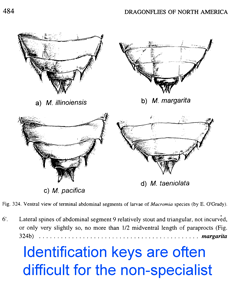
For high school students DNA barcoding seems as natural as texting. You can analyze DNA to identify species? Sure. You only need a trace sample, like a hair or a bit of dried skin? Sure, just like CSI shows. On the other side, many identification keys are not practical for most persons who would like to identify what is in their backyard.

Counting angels with DNA: update

Wednesday, May 28th, 2008

It is impossible to describe biological diversity with traditional approaches. Molecular methods are the way forward–especially, perhaps in the form of DNA barcodes” observed Mark Blaxter in a 2003 Nature commentary, “Counting angels with DNA“, on the first paper proposing “DNA barcodes” as a standardized method for identifying species.

Five years on, how do things look? I believe the scientific and practical value of molecular (ie DNA-based) identification of species is established. Of course visual methods will often be the method of choice to identify specimens in the lab and in the field, but the standardized genetic libraries (aka DNA barcode databases) linked to specimens stored in museums are an increasingly valuable reference for assigning specimens to known species and as a means of species discovery (for more, see www.barcoding.si.edu; www.barcodinglife.org).

In addition to helping identify what is already known, DNA analysis can reveal what would otherwise remain hidden. In 16 May 2008 Science, researchers from Cornell College, Smithsonian Institution, US Department of Agriculture, University of Maryland, and Ithaca College use DNA to reveal hidden diversity in Blepharoneura, a neotropical genus of tephritid fruit flies that feeds within the flowers or fruits of plants in the cucumber family (Cucurbitaceae). To skip to the conclusion, mtCOI sequencing of 2857 flies reared from 24 cucurbit host species collected in six locations in Central and South America revealed 52 morphologically similar species (most were entirely indistinguishable) with “highly conserved patterns of specificity to host taxa and host parts.” Nuclear genes showed the same pattern of genetic clustering as mitochondrial COI.   

This report highlights an exciting scientific challenge raised by genetic surveys of biodiversity, including DNA barcoding: there are far more species, each with biologically specialized traits, than anyone has recognized. Condon et al report “diversity exceeding the original morphologic estimates by an order of magnitude” but conclude this must be an underestimate because of limited sampling (usually along single transects in one season at 6 sites in 5 countries), considering the vast expanse of neotropical forests in Central and South America. Also they used a conservative 4% mtCOI divergence as a cutoff (if 1% cutoff were used, an additional 10 species would be recognized, and several generalist species would be split into narrowly specialized ones).

In closing, I wish the authors had sequenced the barcode region of COI (they analyzed a 693 bp fragment from the 3′ end of the gene which does not overlap with the 5′ DNA barcode region). It would be interesting for example to compile these results with data from the tephritid fly initiative, which aims to collect DNA barcodes from the 4500 known tephritid species. Perhaps these valuable Blepharoneura DNA samples can be reanalyzed for barcode region COI.


Contact: mark.stoeckle@rockefeller.edu

About this site

This web site is an outgrowth of the Taxonomy, DNA, and Barcode of Life meeting held at Banbury Center, Cold Spring Harbor Laboratory, September 9-12, 2003. It is designed and managed by Mark Stoeckle, Perrin Meyer, and Jason Yung at the Program for the Human Environment (PHE) at The Rockefeller University.

About the Program for the Human Environment

The involvement of the Program for the Human Environment in DNA barcoding dates to Jesse Ausubel's attendance in February 2002 at a conference in Nova Scotia organized by the Canadian Center for Marine Biodiversity. At the conference, Paul Hebert presented for the first time his concept of large-scale DNA barcoding for species identification. Impressed by the potential for this technology to address difficult challenges in the Census of Marine Life, Jesse agreed with Paul on encouraging a conference to explore the contribution taxonomy and DNA could make to the Census as well as other large-scale terrestrial efforts. In his capacity as a Program Director of the Sloan Foundation, Jesse turned to the Banbury Conference Center of Cold Spring Harbor Laboratory, whose leader Jan Witkowski prepared a strong proposal to explore both the scientific reliability of barcoding and the processes that might bring it to broad application. Concurrently, PHE researcher Mark Stoeckle began to work with the Hebert lab on analytic studies of barcoding in birds. Our involvement in barcoding now takes 3 forms: assisting the organizational development of the Consortium for the Barcode of Life and the Barcode of Life Initiative; contributing to the scientific development of the field, especially by studies in birds, and contributing to public understanding of the science and technology of barcoding and its applications through improved visualization techniques and preparation of brochures and other broadly accessible means, including this website. While the Sloan Foundation continues to support CBOL through a grant to the Smithsonian Institution, it does not provide financial support for barcoding research itself or support to the PHE for its research in this field.