September 20th, 2009
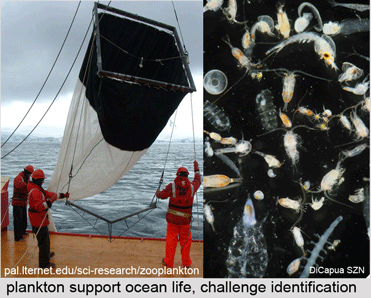 Marine zooplankton comprise an enormous mass of diverse organisms distributed throughout the world’s oceans from deep waters to surface. Zooplankton include representatives of at least dozen phyla, some of which are larval forms of much larger animals, and challenge identification with their diversity and tiny size. In current BMC Genomics (open access) researchers from University of Tokyo and Osaka Medical College, as part of Census of Marine Zooplankton (CMarZ) program of the Census of Marine Life (CoML), apply single-gene sequencing to the task. Machida and colleagues collected at a Micronesia site using a single pass with 2m^2 plankton net from depth of 721 meters to surface, obtaining 60 mL of of zooplankton (large organisms, up to 4 cm, were discarded). Rather than direct DNA sequencing, the researchers isolated mRNA from the pooled sample and constructed a cDNA library from which they analyzed 1,336 inserts. The rationale for these extra steps was to avoid sequencing pseudogenes present in genomic DNA (but not transcribed into mRNA). It would be interesting to know if this strategy was based on experience or is a theoretical precaution.
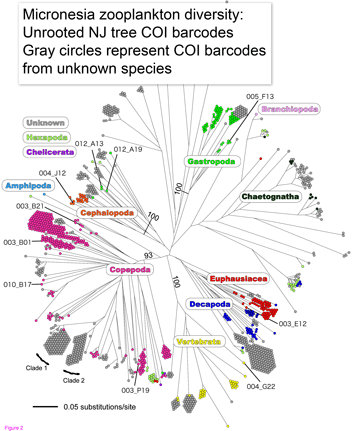 Machida and colleagues found evidence for 189 species, only 10 of which could be confidently matched to reference sequences. This report demonstrates that this sort of “kitchen blender” approach, which has previously been applied largely to bacterial and archaeal communities, shows promise for assemblages of eukaryotes and reveals surprisingly few organisms have reference sequences in databases. Identified organisms included several copepods as well as presumably larval forms of Sthenoteuthis oualaniensis (Purple-back flying squid) and Coryphaena hippurus (Common dolphinfish)!
Species identification by DNA opens major avenues for for ecosystem research. The NJ tree at left suggests that even in absence of close matches, 500 bp of mtDNA is sufficient to sort most specimens into appropriate higher-level groups. To better understand the changing oceans, we need biological monitoring machines akin to physical instruments for studying weather and climate, which routinely monitor thousands of sites. It seems to me the only practical way to monitor biological “weather” is by repeatedly sampling species assemblages at multiple points, and particularly in aqueous environments, automated species identification with DNA will be an important analytic method.
Posted in General by Mark Stoeckle | Comments Off on Counting zooplankton diversity with DNA
September 11th, 2009
Harvesting wild animals for sale as food is a large, mostly illegal business that threatens wild animal populations and puts humans at risk for exotic infections, witness the SARS outbreak in 2003. Regulations and treaties exist, but before these can be enforced, one needs to establish the species origin of bushmeat and other derived marketplace products. Here DNA can help. In 1 September 2009 Conservation Genetics (open access article) researchers from University of Colorado, Barnard College, and American Museum of Natural History describe DNA barcodes for 23 species of South American and Central African primates, ungulates, and reptiles regularly harvested for bushmeat. Equally important as the DNA sequences, Eaton and colleagues report high success (179/204 samples (87.7%)) with primer cocktails first developed for fish DNA barcoding by Ivanova et al 2007, demonstrating these can serve as universal vertebrate primer cocktails. Intraspecific variation was low (mean 0.24%) and differences among congeneric species was generally high (average 9.77%), making assignment to known species straightforward using either tree-based maximum likelihood or character methods.
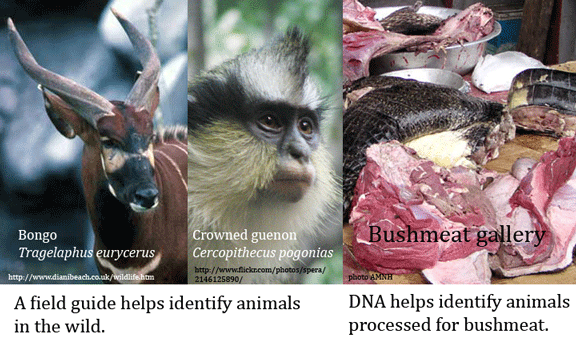
This report is focused on documenting barcodes of bushmeat species, using well-identified vouchered specimens (1 vouchered specimen labeled as Melanosuchus niger (Black caiman) was found to be Caiman yacare (Yacare caiman). The researchers did test a handful of unknown or partially identified specimens; all with recoverable COI sequences could be assigned to known species in the data set using the tree-based or character methods as described. Remarkably, Eaton and colleagues were able to recover COI DNA from 1 of 5 leather goods, which had been impounded by the US Fish and Wildlife Service as likely of CITES species origin. This proved to be Crocodylus niloticus (Nile crocodile). Recovering DNA from leather suggests many unsuspected household items have legible DNA barcodes.
I only wish the research report could have included pictures–there is so much more we might learn. There is an AMNH webpage describing the project which has several interesting images, although these are unlabeled and not referred to by the text. Perhaps we need a “mash-up” utility into which one could insert a scientific paper, which then would pull in relevant material–images, maps, links. Along these lines, there is a very neat Encyclopedia of Life NameLink utility which automatically detects scientific names and inserts hyperlinks to relevant EOL pages–try it!
Posted in General by Mark Stoeckle | 3 Comments »
August 31st, 2009
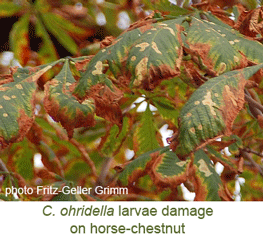 The horse-chestnut leaf miner moth Cameraria ohridella (link to Encyclopedia of Life species page), first described as an apparent endemic in Macedonia in 1984, has steadily expanded its range over the past 25 years, turning once attractive stands of horse-chestnut trees in many urban areas across Europe into unsightly arrays. The damage results from larvae feeding on the leaf interior (ie “leaf mining), causing extensive mottling and leaf loss. C. ohridella is an “invasive pest” in Europe and the subject of an international symposium in Prague in 2004 aimed at identifying biocontrol methods. For such a well-known and important organism, one might expect that scientific information would be readily available. As above, there is an excellent EOL species page, but I was unable to find the original species description online (Deschka G, Dimic N. 1986. Acta Entomologica Jugoslavica, 22, 11-23). A number of museums and universities have print copies of this journal, and I could request a photocopy through Rockefeller University inter-library loan, although of course that service is not available to the public. I did find a complete set of AEJ available from antique bookseller (the journal ceased publication in 1990) for about $500 US! For wider access, I hope that EOL pages will include links to original species descriptions when available as out-of-copyright or open-access.
This leads to report in July 2009 Mol Ecol by researchers from France, Switzerland, Hungary, and Canada, using mitochondrial and microsatellite DNA markers to trace origin of C. ohridella. For this remarkably wide-ranging study, the researchers analyzed 486 specimens from 88 localities in 22 European countries, collecting a single individual per leaf per tree, and if possible, from 30 different trees at each collecting site. To skip to the conclusion, consistent with historical pattern of spread north and west through Europe, the invasive form of the moth appears to be derived from populations infecting wild horse-chestnut trees in the southern Balkans. The genetic diversity was greatest in natural forests in Macedonia, Greece, and Albania, whereas the individuals collected from all “artificial” habitats (ie planted trees in parks, gardens, and roadsides across Europe) had nearly identical COI barcode sequences, consistent with recent expansion from a single source. The important practical conclusion is that biocontrol agents in the form of natural parasitoids are most likely to be found in wild stands of horse-chestnut in southern Balkans. I look forward to more studies on detecting and monitoring invasive species with DNA.
Posted in General by Mark Stoeckle | 5 Comments »
August 11th, 2009
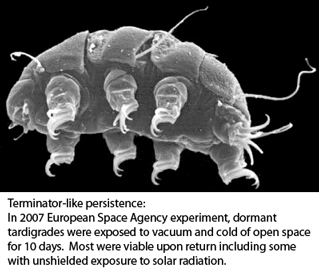 Tardigrades, commonly called water bears, are tiny (0.1-1.5 mm) water-dwelling invertebrates found in diverse environments. About 1000 species are known. Morphologic identification is difficult and may be limited to certain life stages–some species can be identified only from eggs, for example. Tardigrades can transform into a dormant state with remarkable ability to withstand extreme drying, cold, and radiation for prolonged periods, making them of interest for persons studying biology of tissue repair, aging and other fields.
Tardigrade Barcoding Project has just launched their website at www.tardigradebarcoding.org. The project will “provide a set of indispensible tools for the identification of marine, freshwater, and terrestrial tardigrade species, and will greatly aid taxonomists and ecologists. It will also enhance understanding on the evolution, ecology, life-history and extraordinary tolerance of physical extremes for these animals.” I add that COI barcodes are likely to reveal great genetic diversity hidden within morphologically defined species (eg Blaxter et al 2003).
I look forward to learning more about tardigrades!
Posted in General by Mark Stoeckle | 2 Comments »
August 4th, 2009
In this week’s Proc Natl Acad Sci USA, CBOL Plant Working Group, which included 52 researchers from 25 institutions, announced agreement on a DNA barcode for land plants. The authors tell their story:
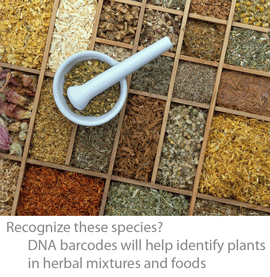 “DNA barcoding involves sequencing a standard region of DNA as a tool for species identification. However, there has been no agreement on which region(s) should be used for barcoding land plants. To provide a community recommendation on a standard plant barcode, we have compared the performance of 7 leading candidate plastid DNA regions (atpF–atpH spacer, matK gene, rbcL gene, rpoB gene, rpoC1 gene, psbK–psbI spacer, and trnH–psbA spacer). Based on assessments of recoverability, sequence quality, and levels of species discrimination, we recommend the 2-locus combination of rbcL and matK as the plant barcode. This core 2-locus barcode will provide a universal framework for the routine use of DNA sequence data to identify specimens and contribute toward the discovery of overlooked species of land plants.”
The Working Group concludes: ” There is little doubt that the approaches used in plant DNA barcoding will be refined in the future. However, the key foundation step for plant barcoding is in reaching agreement on a standard set of loci to enable large-scale sequencing and the development of a global plant barcoding infrastructure. The broad community agreement presented here, to sequence rbcL and matK as a standard 2-locus barcode, is thus an important step in establishing a centralized plant barcode database as a tool for taxonomy, conservation, and the multitude of other applications that require identification of plant material.”
In the same issue of PNAS, a Commentary by Jesse Ausubel traces the development of DNA barcoding, from a proposal in 2003 for a standardized DNA-based approach to species identification, using mitochondrial COI gene for animal species. Adopting COI as a standard was the essential first step, leading to a rapidly growing library now with over 620,000 specimens from over 58,000 species, enabling high-school students to become identification experts for store-bought fish items and shedding new light on species diversity. With the publication of this paper, DNA-based identification for land plants is now poised to expand rapidly, with benefits to science and society. Ausubel views DNA barcoding enterprise as an urgently needed “macroscope” for probing ecological and evolutionary patterns on a broad scale. He concludes with a call “to accept the invitation of the 52 authors led by Hollingsworth to use the standard two-locus barcode of matkK and rbcL to join in building a powerful botanical macroscope.”
Posted in General by Mark Stoeckle | Comments Off on Botanists establish DNA barcode for land plants
July 26th, 2009
How does one collect tropical reef fish without leaving North America? In July 2009 PLos ONE researchers from University of Guelph report on genetic diversity in SE Asian tropical reef fish, collected without plane fares or permits. How did they do it? Steinke and colleagues analyzed “dead on arrival” marine fish imported into Canada for the ornamental pet trade from various locations in SE Asia. A total of 1631 specimens representing 391 named species were frozen, imaged on a flatbed scanner, and a muscle tissue sample was taken for COI analysis. This is remarkable on several counts. First, the large number of species–according to FAO report cited by Steinke, “some 800 marine fish species, representing about 5% of all marine taxa, are involved in this trade, with 70% of sales directed to North America,” and estimated revenue of $200-$300 million annually. Second, this study surveys genetic biodiversity in reef fishes, provides a practical method for identification, and at the same time provides insight into what is probably the major threat to their survival. I am reminded of near extinction of Common egrets in North America in the late 1800’s as a result of hunting for plumes in women’s hats. This led to a popular uprising among women of fashion, who pledged not to wear such clothing, organizing what were the first “Audubon Societies” and successfully petitioning for legislative change, saving egrets and many other birds. Nemo and other reef fish may need a similar campaign.
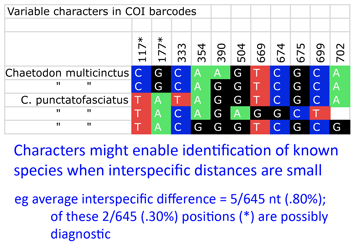 Back to the study, Steinke and colleagues found distinct barcodes among 384/391 (98.2%); 9 species displayed 2 or 3 distinct clusters, most of which were allopatric. Review of these potential “splits” revealed possible inappropriate synonymization in several cases. On the other side, 2 pairs and 1 triplet of species were not distinguished by DNA barcodes using distance. I look more closely at one of these examples, butterfly fishes Chaetodon multicinctus and C. punctatofasciatus, to see if there might be diagnostic characters whose signal is swamped by intraspecific variation. As in figure, there are 2 possibly diagnostic differences among this species pair. Of course, this sort of analysis only works for known species, but I wonder how many other species pairs/sets with “overlapping” barcodes have diagnostic differences.
Posted in General by Mark Stoeckle | 1 Comment »
July 17th, 2009
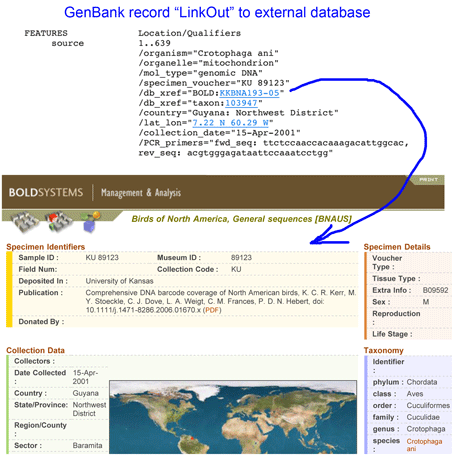
A core tenet of DNA barcoding initiative, beginning with the first workshops in 2003, is that reference sequences should be linked to vouchered specimens stored in museums, so that data can be re-checked. This also provides visibility to collections. For example, “GenBank DQ433554 Crotophaga ani voucher KU 89123 cytochrome oxidase subunit 1 (COI) gene, partial cds; mitochondrial” contains voucher information in the title and the record itself, at least for those who know “KU” refers to University of Kansas. The GenBank file contains a “LinkOut” to the BOLD page which spells out the collection name. The GenBank file (and the BOLD record) could also include a “LinkOut” to the museum itself, although I do not find examples of this feature being used.
More generally, is collection information available in GenBank records? Taking birds as an example, there are 475,273 GenBank avian records; eliminating the five most-represented species (Chicken, Turkey, Mallard, Zebra Finch, Fairy Wren) leaves 108,766 sequences, of which about half (48,915) contain the word “voucher.” This sounds promising but my unscientific sample suggests most entries in the “voucher” field are cryptic designations that do not identify the institution storing the specimen. I tried searching by acronyms for some of the larger collections. Louisiana State University has the largest avian tissue collection in the world with about 40,000 specimens; searching “LSU AND aves[organism] AND voucher” returned only 1,148 records, which seems likely to underrepresent the museum’s contribution. Results for some other large collections were higher but still appear to be incorrectly small considering there are 100,000+ avian GenBank records: (Burke Museum (UWBM) 3,318; Field Museum (FMNH), 2,593; American Museum of Natural History (AMNH), 1,994; Smithsonian (USNM), 1,920; University of Kansas (KU), 684 records).
I conclude that researchers and collections will benefit from following practices promoted by DNA barcode initiative for GenBank records including taking advantage of GenBank’s “LinkOut” feature.
Posted in General by Mark Stoeckle | 2 Comments »
July 8th, 2009
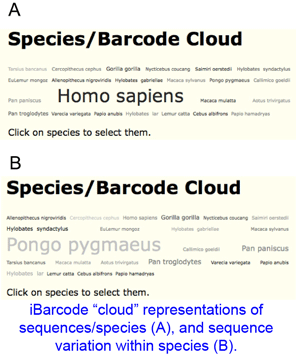 In 16 june 2009 BMC Bioinformatics researchers from University of Guelph report on web platform for DNA barcode analysis, www.iBarcode.org. The site works with aligned barcode files in standard .fas format, such as produced by MEGA or BOLD. Registration is not required; the site keeps track of files you have uploaded.
According to authors Singer and Hajibabaei, iBarcode is designed to “allow the user to manage their barcode datasets, cull out non-unique sequences, identify haplotypes within a species, and examine the within- to between-species divergences.” iBarcode provides several clever, easy-to-use tools and I look forward to further refinements.
.
.
.
.
.
.
Posted in General by Mark Stoeckle | Comments Off on www.iBarcode.org: web tools for sequence analysis
June 30th, 2009
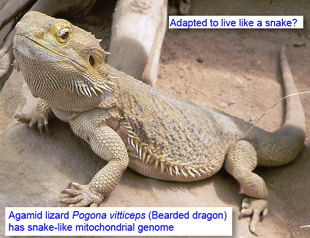 In 2 june 2009 Proc Natl Acad Sci USA researchers from 5 American universities report on convergent molecular evolution among agamid lizards and snakes. In constructing a nuclear and mitochondrial DNA phylogeny of squamates (snakes and lizards), Castoe and colleagues noted their data placed agamid lizards as sister to snakes, rather than within lizard clade Iguania, as supported by prior work including morphology. The apparently aberrant phylogenetic placement was due to similarity among mitochondrial genomes of agamid lizards and snakes; nuclear genes recovered the established tree. Most of the aberrant signals were in first and second codon positions in protein-coding genes, and thus associated with similarity in predicted amino acid sequences among agamids and snakes. These convergent changes were distributed across all 13 mitochondrial protein-coding genes, but were clustered particularly in COXI and ND1.
The authors conclude that there was an ancient adaptive episode in the ancestors of today’s agamid lizards, which led to a snake-like mitochondrial genome. I note this conclusion is based on analyzing just 2 of the more than 350 species in 52 genera in Agamidae. Are these changes universal in Agamidae? There are 2 more complete agamid mitochondrial genomes in GenBank which could be examined; of additional interest would be to see if the same convergent changes are found in the 253 COI sequences from 88 agamid species in 11 genera in BOLD. As in this study, phylogenetic reconstruction usually involves just a few representatives of each lineage, which means that evolutionary patterns may remain invisible. I expect that BOLD will be an increasingly useful resource to expand the scope of phylogenetic studies utilizing mitochondrial DNA.
The conclusion that these findings represent convergent adaptive evolution is strong, yet it is also puzzling, as at first glance there doesn’t seem to be any special morphological or life-style resemblance between snakes and agamids as compared to other lizards. Perhaps we need to keep an open mind for other seemingly unlikely mechanisms, such as eukaryotic horizontal gene transfer.
Posted in General by Mark Stoeckle | 1 Comment »
June 16th, 2009
What fish is that you are eating? This question has many possible answers. Unlike meats, which are derived from a handful of species, most of which are farmed, there are numerous fish sold for human consumption, most of which are wild. The US FDA Regulatory Fish Encyclopedia and the Canadian Food Inspection Agency lists of approved fish and shellfish include approximately 1700 and 660 names, respectively. And yet DNA surveys regularly turn up fish in the marketplace that are not on any regulatory list, as well as mislabeling of those that are listed, suggesting we may not know what we are eating or what fish stocks are being harvested.
 In addition to economic and environment impact, mislabeling can have public health implications. In April 2009 J Food Protection government and research scientists report on 2 cases of tetrodotoxin poisoning in Chicago, IL resulting from ingestion of soup prepared from mislabeled puffer fish, sold as “monkfish.” Two additional cases were traced to the same supplier and this led to the recall of several thousand pounds of frozen fish. Morphologic examination of leftover parts and DNA testing of the cooked meat implicated Lagocephalus sp., most likely Green roughed-back puffer L. lunaris. Unlike most other toxic puffer species, L. lunaris tetrodotoxin is in muscle as well as organ tissue, making safe preparation impossible. At the time of the study, there were no reference sequences in BOLD for L. lunaris, so the DNA barcode identification was incomplete. It would be of interest to repeat the database searches (as of today GenBank contains 1 L. lunaris COI sequence and BOLD taxonomy browser lists 2), but for some reason the sequences obtained by the researchers were not published.
DNA testing is the only way to identify many of the fish items in the marketplace. I expect that standardized DNA testing (aka DNA barcoding) will play an increasingly important role in helping protect both consumers and fish.
Posted in General by Mark Stoeckle | 1 Comment »
 Marine zooplankton comprise an enormous mass of diverse organisms distributed throughout the world’s oceans from deep waters to surface. Zooplankton include representatives of at least dozen phyla, some of which are larval forms of much larger animals, and challenge identification with their diversity and tiny size. In current BMC Genomics (open access) researchers from University of Tokyo and Osaka Medical College, as part of Census of Marine Zooplankton (CMarZ) program of the Census of Marine Life (CoML), apply single-gene sequencing to the task. Machida and colleagues collected at a Micronesia site using a single pass with 2m^2 plankton net from depth of 721 meters to surface, obtaining 60 mL of of zooplankton (large organisms, up to 4 cm, were discarded). Rather than direct DNA sequencing, the researchers isolated mRNA from the pooled sample and constructed a cDNA library from which they analyzed 1,336 inserts. The rationale for these extra steps was to avoid sequencing pseudogenes present in genomic DNA (but not transcribed into mRNA). It would be interesting to know if this strategy was based on experience or is a theoretical precaution.
 Machida and colleagues found evidence for 189 species, only 10 of which could be confidently matched to reference sequences. This report demonstrates that this sort of “kitchen blender” approach, which has previously been applied largely to bacterial and archaeal communities, shows promise for assemblages of eukaryotes and reveals surprisingly few organisms have reference sequences in databases. Identified organisms included several copepods as well as presumably larval forms of Sthenoteuthis oualaniensis (Purple-back flying squid) and Coryphaena hippurus (Common dolphinfish)!
 The horse-chestnut leaf miner moth Cameraria ohridella (link to
  Tardigrades, commonly called water bears, are tiny (0.1-1.5 mm) water-dwelling invertebrates found in diverse environments. About 1000 species are known. Morphologic identification is difficult and may be limited to certain life stages–some species can be identified only from eggs, for example. Tardigrades can transform into a dormant state with remarkable ability to withstand extreme drying, cold, and radiation for prolonged periods, making them of interest for persons studying biology of tissue repair, aging and other fields.
 “DNA barcoding involves sequencing a standard region of DNA as a tool for species identification. However, there has been no agreement on which region(s) should be used for barcoding land plants. To provide a community recommendation on a standard plant barcode, we have compared the performance of 7 leading candidate plastid DNA regions (atpF–atpH spacer, matK gene, rbcL gene, rpoB gene, rpoC1 gene, psbK–psbI spacer, and trnH–psbA spacer). Based on assessments of recoverability, sequence quality, and levels of species discrimination, we recommend the 2-locus combination of rbcL and matK as the plant barcode. This core 2-locus barcode will provide a universal framework for the routine use of DNA sequence data to identify specimens and contribute toward the discovery of overlooked species of land plants.”
 Back to the study, Steinke and colleagues found distinct barcodes among 384/391 (98.2%); 9 species displayed 2 or 3 distinct clusters, most of which were allopatric. Review of these potential “splits” revealed possible inappropriate synonymization in several cases. On the other side, 2 pairs and 1 triplet of species were not distinguished by DNA barcodes using distance. I look more closely at one of these examples, butterfly fishes Chaetodon multicinctus and C. punctatofasciatus, to see if there might be diagnostic characters whose signal is swamped by intraspecific variation. As in figure, there are 2 possibly diagnostic differences among this species pair. Of course, this sort of analysis only works for known species, but I wonder how many other species pairs/sets with “overlapping” barcodes have diagnostic differences.
 In
In  In
In  In addition to economic and environment impact, mislabeling can have public health implications. In