Area of Research: Forests, Farms and Materials
Comparative LCA of concrete with natural and recycled coarse aggregate in the New York City area
Lightening the Tread of Population on the Land: American Examples
Nitrogen on the Land: Overcoming the Worries – lifting fertilizer efficiency and preserving land for nonfarming uses
Nitrogen Fertilizer
In 1931, Karl Bosch received the Nobel Prize for making nitrogen fixation practical. Like many new technologies, synthetic nitrogen fertilizer enjoyed strong growth, from 1.3 Tg nitrogen in 1930, to 83 Tg in 1998. (One Tg equals a trillion grams or a million metric tons. These data refer to the fertilizer year 1 July-30 June. Thus, for example, 1998 data are for 1998-99.) By “synthetic nitrogen fertilizer,” we mean commercial product, with almost all the nitrogen fixed by the Haber-Bosch process — in contrast to manure, guano, oil meals, and packing-house waste.
Is the use of nitrogen fertilizer growing exponentially? No. A constant percentage increase accelerates a curve exponentially. This is not what is happening with nitrogen fertilizer.
After an explosive annual growth of 14% during the period 1945-56, global growth of nitrogen fertilizer use slowed to 8% as 1970 approached. Growth then slowed further to 5% yearly during 1976-85, and to less than 1% during 1986-98. In Europe and the United States, which adopted the new technology early, growth slowed even sooner. Since 1976, use in Europe and the U.S. has grown 1% or less yearly, and sometimes has actually fallen.
Like numerous products that saturate their market, nitrogen fertilizer fits not an ever-rising exponential growth pattern, but an S-shaped logistic one (Frink et al. 1999).
Nitrogen Deposition
The nitrogen falling from the atmosphere, mostly as NO3-nitrogen and NH4-N (ammonium-N), can be measured by simply collecting it in the open as “bulk deposition.”
“Wet deposition” is collected only during precipitation. “Throughfall” is nitrogen deposited on forest canopies and eventually falling or washing down in precipitation. Nineteenth century agronomists, who were concerned about deposition on crops, collected bulk deposition. More recently, scientists concerned about acid rain (caused by sulfur and nitrogen) collected wet deposition, and ecologists concerned about accumulation of nitrogen in forests collected throughfall beneath trees.
In order to understand nitrogen deposition, we must compare it with some scale. Synthetic fertilizer use has increased approximately 100 fold. Concurrently, worldwide NO3-nitrogen from high temperature combustion in car motors and power plants has risen 10-fold to about 20 Tg.
Farmers increase crop yields with 100 to 200 kg nitrogen ha-1 (kilograms per hectare). For prevention of eutrophication and 95% safety, Europe has established incremental critical loads of 3-10 kg ha-1 (with standards of less than 3 and more than 10 in some places) (Posch et al. 1997).
In infertile soil made responsive by fertilization with other nutrients, increments as little as 10 kg, but sometimes not less than 54 kg, nitrogen ha-1 decreased biodiversity (Tilman 1987). Early in the 20th century, bulk deposition in Europe and the U.S. was 4 to 7 kg ha -1.
Anyone smelling a barnyard knows local deposition of NH4-N can be high. In the Netherlands, a local throughfall of 100 kg ha-1 attributed to animals will affect vegetation (Ivens, 1990). The manure km-2 in the Netherlands is five times that in the quintessential U.S. agricultural state of Iowa. Locally, where animals are concentrated, throughfall can approach farmers’ fertilizer rates.
However, deciding whether widespread, rather than local, increase of nitrogen deposition accompanied the use of more nitrogen fertilizer requires measurements spanning decades at several places. For a comparison that offers data over a period as long as the growth of fertilizer use, we must turn to the simple, robust measure of bulk deposition. In Rothamsted, England, annual deposition rose a total of about 1 kg ha-1 between 1888 and 1966. Bulk deposition of 8.7 kg (estimated from wet deposition during 1987-96 at nearby Woburn) confirms an increase, perhaps 5 kg ha-1 during the century.
In northern Netherlands, bulk deposition increased about 7 kg from 6.7 kg ha-1 at Groningen during 1908-10 to 14.5 kg at nearby Kollumerwaard during 1994. In Sweden, it changed little from the 5.1 kg ha-1 at Flahult in 1909 to 7.1 kg in 1996-97 at three nearby stations (Frink et al. 1999).
At Geneva and at Ithaca, New York, during the first quarter of the 20th century, annual bulk deposition ranged from 4 to 8 kg ha-1. About 6 kg was also deposited at Mays Point and Huntington Forest, New York, during 1965-80 and also at Hubbard Brook, New Hampshire, during 1972-92 (Frink et al. 1999). In the northeastern United States during the 20th century, bulk deposition changed little.
One should not be surprised that nitrogen fertilizer use and widespread increase of nitrogen deposition did not rise in tandem. Except for escape of some ammonia fertilizer and dust and a little NO2, no direct path puts fertilizer nitrogen in the air for deposit. Also, even 80 Tg fertilizer nitrogen plus 20 Tg NO3-nitrogen from high temperature combustion is insufficient to increase widespread deposition significantly; in the impossible case of all 100 Tg being deposited, it would average only about 2 kg ha-1 on Earth. The low concentration of nitrogen in Greenland precipitation (Mayewski et al. 1990) corresponds to deposition far less than that.
Given the moderate likely rise in nitrogen use that we now project, prospects seem good for any future increase in deposition to continue making the minor contribution to plant growth that Nadelhoffer et al. (1999) have calculated is now being made. This should pose little hazard to biodiversity.
Prospects to 2070
After overcoming worries about exponential increase and widespread rising deposition, we still come to the lurking fear of burgeoning, richer humans eventually demanding farmers smother Nature with multiples of today’s nitrogen in order to grow more food. Although nitrogen from fertilizer can scarcely increase widespread atmospheric deposition, its leaching and pollution of water justify conservation.
Foreseeing what humanity will eventually demand requires integrating forces that drive fertilization (Frink et al. 1999). The change of fertilizer use (see Exhibit 1) is the sum of changes in four forces: population, GDP/capita, crop production/GDP, and the Ratio of nitrogen in fertilizer to nitrogen in crops, which we capitalize to “Ratio.” (We neglect the small change over time in the nitrogen composition of the crop mix.) To foresee prospects to 2070, and a population of roughly 10 billion people, we assume a population growing at 0.8% and GDP per capita at 1.8%, to lift their sum, the total GDP, to 2.6% per year.
Although wealthy people eat better than the poor do, they do not eat more in fixed proportion to GDP. Hence, the declining ratio of crops to overall GDP has mirrored the rise of world GDP. Whereas the GDP/Cap data in Exhibit 1 are above the zero change line, the Crop/GDP are below the zero change line, signifying a falling ratio of crops to GDP. Expecting that the world economy will continue to favor computer chips over potato chips, we project a long decline of 1.0%/year in crop/GDP. The sum of GDP per capita rising 1.8%, and crop/GDP falling 1.0%, still raises the crop for all persons by 2070 to the level that rich countries enjoy now.
Farmers control the fertilizer per crop as they economize inputs. Globally, the Ratio of fertilizer nitrogen to crop nitrogen recently plummeted 2.0%/year. In the United States, it fell earlier, and since the 1970s has fallen some 1.0%/year. For the long pull, a decline of 0.5%/year seems reasonable as farmers continue lifting yields faster than their nitrogen fertilizer use grows. The sum of the changing forces (0.8 + 1.8 – 1.0 – 0.5%/year) would raise world nitrogen fertilizer use 1.1%/year to 2.4 times the 1990 use by 2070.
Concern for sparing only fertilizer would be myopic. We integrate with the saving of fertilizer the sparing of land, which is preeminent for sparing Nature. Accordingly, we project cropland taken as well as fertilizer used (see Exhibit 2).
As a baseline for prospects to 2070, consider the situation in 1990, when 79 Tg fertilizer and 11% of world land yielded the caloric equivalent of 1,900 kg ha-1. The 150% Ratio of fertilizer nitrogen to crop nitrogen shows that nitrogen from fertilizer, plus that from legumes and manure, far exceeds nitrogen incorporated into crops, indicating an opportunity for conservation.
Our first projection for 2070 (and assuming a population of ten billion people) is a situation in which farming has stagnated at 1990 levels in terms of yields and Ratio. The consequent 284 Tg fertilizer nitrogen, or 3.6 times 1990 use, exceeds the 2.4 times projected above because the Ratio remains 150%. Under this projection, cropland has expanded because population and crop per capita has grown, while yield has stagnated. A scenario assuming use of 284 Tg nitrogen, and 38% of the land, offers the scary specter of population and wealth eventually demanding that farmers push Nature aside and smother the land in fertilizer.
Researchers can forestall that specter becoming reality with at least two levers: Substitute nitrogen already on farms for nitrogen fertilizer, and raise yields, thus lowering the Ratio of fertilizer nitrogen to crop nitrogen.
Farms fix nitrogen in legumes and collect nitrogen in manure. Although so-called alternative agriculture features nitrogen fixed by legumes, legumes take land and devour natural habitat. Manure is another matter. The estimated 80 Tg nitrogen in the world’s manure matches the 83 Tg fertilizer nitrogen used now and is significant compared to the projected 284 Tg. Remembering that some manure nitrogen is already captured in crops, but that animals may multiply by 2070, one can envision 50 Tg of manure nitrogen substituting for fertilizer nitrogen, decreasing the fertilizer-nitrogen-to-crop-nitrogen Ratio to 124% with crops still using 38% of the land.
The ancient challenge of saving and storing nitrogen without odor continues. Concentration of animals has focused attention on odor and increased the distances for hauling manure to fields. It has also changed the goal from conserving nitrogen to denitrifying it and controlling odor. A challenge for pollution prevention is replacing the negative tasks of regulating odor and returning N2 to the air with the positive task of discovering profitable and practical ways to move more of the dilute nitrogen in manure into crops.
Conserving fertilizer can also lower the Ratio of fertilizer nitrogen to crop nitrogen. Conservation includes testing soil nitrogen and adjusting application to each site by precision farming and splitting applications during the season to avoid leaching. Because yields divide the Ratio, higher yields can lower the Ratio and spare land, too. Increasing yields to lower the Ratio involves breeding better crop varieties, plus removing limitations such as other nutrients, water, and pests so that crops can exploit the nitrogen provided.
While words about lowering the Ratio of fertilizer nitrogen to crop nitrogen could be mere anecdotes, statistics show farmers are in fact doing it (see Exhibit 1). During the 1980s and 1990s the worldwide Ratio fell. In the United States since the 1970s, the Ratio of fertilizer nitrogen to crop nitrogen fell about 1%/year. With regard to a specific locale and crop, the Ratio for Indiana, Iowa, and Nebraska corn fell 1% to 3% per year during 1980-96 (Frink et al. 1999). Farmers lifting the world average yield of corn, rice, soybeans, and wheat by an annual average of 1.6 to 2.3% during 1961-2000 demonstrate that higher yields also are not mere anecdotes.
A projection involving slower lifting of yields, but conserved nitrogen, shows that raising yields 1% and lowering the Ratio 0.5%/year would take 19% of land, while lowering nitrogen fertilizer use to 192 Tg. This is the 2.4-fold increase we deem probable.
With sustained lifting of yields and conserved nitrogen, raising yields 2% and still lowering the Ratio of fertilizer nitrogen to crop nitrogen would require the same 192 Tg of nitrogen, but would actually shrink cropland 144 million hectares, which is about half the area of India, or ten Iowas.
Today, fertilizer manufacturers have idle capacity. This, combined with weak agricultural markets in Europe and the U.S., reveal how groundless are fears that fertilizer use will soon explode. There is little prospect of a widespread downpour of nitrogen from the air, or Nature pushed aside to relieve hunger.
Outline for Future Action
For the long run, however, and to relieve “hot spots” of nitrogen deposition, several things need to be done. On the grand scale, regulators need to monitor two simple environmental metrics: land spared from cropland expansion and the Ratio of fertilizer nitrogen to crop nitrogen.
On the local scale, where action is taken, fertilizer manufacturers should offer information on how to make fertilizer go further while farmers, the most hard-pressed actors, struggle to survive. Researchers, the actors with the most opportunity to effect change, should devise affordable ways for farmers to utilize manure (now seen as a nuisance) for higher yielding crops.
Meeting these challenges will temper the use of nitrogen fertilizer, while sparing more land for Nature.
Exhibits
Exhibit 1. Annual Global Changes in Population, GDP per Capita, Crop Production per GDP, and the Ratio of Synthetic Fertilizer Nitrogen to Crop Nitrogen.
Exhibit 2. Prospects to 2070.
References
Ivens, W.P.M.F. (1990). Atmospheric Deposition onto Forests. Analysis of the Deposition Variability by Means of Throughfall Measurements. Nederlandse Geographische Studies 118, 151 p.
Mayewski, P.A., et al. (1990). An Ice-Core Record of Atmospheric Response to Anthropogenic Sulphate and Nitrate. Nature 346:554-556
Moffat, A.S. (1998). Global Nitrogen Overload Problem Grows Critical. Science 279:988.
Nadelhoffer, K.J., et al. (1999). Nitrogen Deposition Makes a Minor Contribution to Carbon Sequestration in Temperate Forests. Nature 398:145-148.
Posch, M., Hettelingh, J.-P., de Smet, P.A.M., & Downing, R.J. (1997). Calculation and Mapping of Critical Thresholds in Europe. RIVM Report 259101007.
Tilman, D. (1987). Secondary Succession and the Pattern of Plant Dominance along Experimental Nitrogen Gradients. Ecological Monographs 57:189-214.
Vitousek, P.M., et al. (1997). Human Alteration of the Global Nitrogen Cycle: Sources and Consequences. Ecological Applications 7:737-750.
Charles R. Frink (charles.frink@po.state.ct.us) is a soil expert and scientist emeritus at the Connecticut Agricultural Experiment Station in New Haven. Paul E. Waggoner (paul.waggoner@po.state.ct.us) is an agronomist and meteorologist, and past director of the Connecticut Agricultural Experiment Station. Jesse H. Ausubel (ausubel@mail.rockefeller.edu) is an industrial ecologist and director of the Program for the Human Environment at The Rockefeller University in New York City (https://phe.rockefeller.edu).
On Sparing Farmland and Spreading Forest
Prepared as a plenary talk for the September 2001 Denver convention of the Society of American Foresters, it was not delivered because of 9/11 but is published in the proceedings.
Think first not of forest but of farmland. Agriculture is shrinking. In this essay I share some views of the evolution of agriculture and then turn to their implications for forests.
SPARING FARMLAND
Analysis of farming shows a coherent pattern of evolution from Neolithic times up to our new millennium (Marchetti 1979). All technical advances have been exploited for intensification, to increase the specific productivity of land. Yields per hectare measure the productivity of land and the efficiency of land use. Low yields squander land, and high yields spare land.
In the human beginning, as hunter-gatherers, we did not differ from many other animals. We met the pressure to grow by extending our geographical habitat as well as our range of digestible foods. In the latter regard, we made great breakthroughs with energy. Plants defend themselves against predators with a panoply of weapons. The most important are chemical and tend to make the plant indigestible and occasionally poisonous. Animals developed other defenses. Human genius was to apply thermal treatment to upset or destroy the delicate organic chemistry of defense. Boiling softens flinty rice and maize, and ovens convert past wheat into bread. Seven minutes of boiling soybeans denatures the trypsin inhibitor that would otherwise render tofu useless to us. Fire revolutionized food, permitting digestion of much plant material and seeds in particular, and in most cases improving taste as well.
Farming amplifies the production of biological material assimilable directly or by thermal treatment. Humans ally with certain plants by collaborating in their reproductive cycle and by fighting their natural enemies. We put ourselves first among selective forces, picking the plants most profitable from our point of view. Or, plants trick us with fruit and ornament into amplifying their evolutionary advantage.
What then has driven the laborious development of agriculture? After filling available geographical niches, the only way to expand is intensification. Agriculture essentially reduces the amount of land needed to support a person. The fruits of agriculture consequently support the human drive to multiply.
Draft animals were the first big advance. Draft animals did not reduce human toil. Peasants with animals work as hard as those without. Nor did draft animals drastically lift the productivity per worker, though an Iowan with a team could till far more than an Incan with a spade. Draft animals did increase the specific productivity of the land. Ruminants are the most successful symbiotic draft animals. Rarely competing with humans for food, they digest roughage and poor pasture, extracting energy from cellulose and properly managing nitrogen through the rumen’s flora. Still, draft animals take land. In some farming systems, one quarter or more of the land may be needed for oxen, horses, and other draft animals.
Chinese agriculture circa 1900 represents a high point of farm evolution. Without machines but using a thousand bioinformatic tricks, Chinese farmers reduced the amount of land needed to support a person to 100 square meters. Compare this space, about equal to a one-bedroom American apartment, to a few square kilometers for a hunter-gatherer. The difference is a factor of 104, or 10,000 times in intensification.
The ecological systems the farmers created, although often visually appealing, bear no resemblance to any natural ecosystem, if only because of great structural simplification. Equilibrium and resilience tend to be lost, and the system becomes unstable and difficult to manage. The wits and toil of about half the Chinese population are still employed to keep it going.
After the summit reached by the Chinese, farm evolution could continue only with a qualitative breakthrough. It came, like cooking, with the introduction of external energy, in this case fossil fuels. Starting around 1900 we tamed machines for the same purposes as draft animals, and started to synthesize chemicals rather than collect guano or manure. The two innovations, machines and chemicals, especially the latter, hugely increased yields.
After World War II, the automobile industry produced solid, cheap, dependable tractors. A tractor pulls as powerfully as 10 to 50 teams of oxen. Tractors proportionately increased the productivity of labor, without however substantially intensifying production. The machines did permit extension of cultivable land, and some gain in specific productivity came at the level of the farm, because the machines freed land that had produced feed for draft animals to produce for other purposes. In short, tractors released workers from the farms but did not grow much more corn per hectare.
The effect of chemicals, in contrast, fits the master trend of intensification perfectly. Fertilizers, most obviously, are intensifiers. They have always been used. The external energy of fossil fuels permitted their massive, economical, and convenient synthesis beginning about 1950.
The breakthroughs in external energy inputs allowed expansion and intensification of agriculture much faster than population growth, particularly in the United States. The difference created huge surplus capacity, especially for grains, and caused the invention and diffusion of the hamburger, a popular solution to the surplus.
In fact, as people get richer, they consume more calories and protein up to limits of satiety and taste. Given possible future diets and numbers, how much land can people spare for Nature? This is a question agronomist Paul Waggoner and I started asking about 10 years ago. The answer explains why forests will spread. Before giving the answer, let me broaden the context.
GREAT REVERSAL, GREAT RESTORATION
By the 1990s evidence accumulated that several major environmental indicators had passed an inflection point (Ausubel 1996). The most famous inflection is population growth rate.
Figure 1. Reversal in total U.S. water use, per capita, per day.Sources of data: U.S. Bureau of the Census, Historical Statistics of the United States, Colonial Times to 1970 (Washington, D.C.: U.S. GPO, 1975). U.S. Bureau of the Census, Statistical Abstract of the United States: 1998, 118th edition(Washington, D.C., 1997).
The rate of growth of world population peaked at about 2 percent between 1965-1970. Fertility rates have continued to fall in most of the world the past 30 years.
Water use offers examples not only of slowing growth but of reversal. Both the withdrawal and consumption of water per capita peaked in the United States about 1980 (Figure 1), and the national total withdrawal also peaked in 1980 while consumption leveled. In the forest world, the reversal of deforestation had been discovered and named the Forest Transition (Mather et al. 1999). In recent decades some 50 countries have reported increases in the volume or area of their forests (UN ECE/FAO 2000).
A growing library of examples suggests that actually a Great Reversal in the exploitation of Nature has occurred (Ausubel 2001). Of course, we want to know how far the Great Reversal could extend. Could we envision a Great Restoration?
Visions necessarily entail targets or goals, whether for individuals, firms, or the planet. Goals provide orientation. They help actors to aspire and measure progress. In 1999, John Spears, a consultant to the World Bank, developed a preliminary, quantitative vision of world forests for the year 2050. The vision was exciting and worrisome: exciting because it could concert much work, worrisome because it accepted 200 million hectares more net deforestation, roughly the area of U.S. timberland. Yet, we all knew powerful reasons to spread forests: to increase habitat, sequester carbon, allow forests for traditional users, and keep wood products cheap and abundant.
Several of us, including Spears, agreed to start a process to create a vision worth realizing, one that restores Nature and merits investment. Together with the World Bank, the World Wildlife Fund, Council on Foreign Relations, and Rockefeller University joined in a Great Restoration project to develop an attractive and feasible vision for the world’s forests.
The Great Restoration project explored a range of questions:
–How widespread is the forest transition, the Reversal?
–What might be the size and character of the demand for wood products over the next 50 years?
–How much can higher growth rates of trees contribute to lessening demand for woodlands to be logged?
–What about “sacred groves”? Could, for example, new classifications of forested lands make a difference?
–What models of consent among different stakeholder groups are appropriate for a Restoration vision?
–What might be the spatial distribution of the Great Restoration?
–How can national and international law and institutions exert leverage?
As I will share with you later, we were able to create a feasible and attractive vision, with more forest in 2050 than today. Unsurprisingly, a key was the answer to the question, How much can farmers help by sparing land?
WHAT FARMERS CAN OFFER
If farmers lift yields 1 percent per year and population grows by 2 percent per year while diet remains steady, land must be cleared for crops. If farmers lift yields 2 percent per year and population grows 1 percent per year, land is spared. For centuries, globally, land cropped expanded, and cropland per person even rose as people sought more proteins and calories. China’s brilliant yields were five times those of the crude farming of America and most of the rest of the world. But 50 years ago, rapidly lifting the specific productivity of land, the world’s farmers stopped plowing up Nature (Figure 2). During the past half-century, ratios of crops to land for the world’s major grains—corn, rice, soybean, and wheat—have climbed fast on all continents.
Figure 2. Reversal in area of land used to feed a person. After gradually increasing for centuries, the worldwide area of cropland per person began dropping steeply in about 1950, when yields per hectare began to climb. The square shows the area needed by the Iowa Master Corn Grower of 1999 to supply one person a year’s worth of calories. The dotted line shows how sustaining the lifting of average yields 2 percent per year extends the reversal. Sources of data: Food and Agriculture Organization of the United Nations, various Yearbooks. National Corn Growers Association, “National Corngrowers Association Announces 1999 Corn Yield Contest Winners, Hot Off the Cob,” (St. Louis, Mo., 15 December 1999). J.F. Richards, “Land Transformations,” in The Earth as Transformed by Human Action, B.L. Turner II et al., eds. (Cambridge University: Cambridge, U.K., 1990).
Per hectare, the global Food Index of the Food and Agriculture Organization of the UN, which reflects both quantity and quality of food, has risen 2.3 percent annually since 1960. In the United States in 1900 the protein or calories raised on one Iowa hectare fed four people for the year. By the year 2000 a hectare on the Iowa farm of Mr. Francis Childs could feed 80 people for the year, comparable to the most intensive Chinese agriculture. The Chinese, of course, kept lifting the comparison as they lifted cereal yields 3.3 percent per year between 1972 and 1995.
Since the middle of the twentieth century, such productivity gains have stabilized global cropland, and allowed many nations, including China, to shrink cropland. Meanwhile, growth in calories in the world’s food supply has continued to outpace population, especially in poor countries. A cluster of innovations including not only tractors and chemicals, but also seeds and irrigation, joined through timely information flows and better organized markets, raised the yields to feed billions more without clearing new fields.
High-yield agriculture need not tarnish the land. The key is precision agriculture. This approach to farming relies on technology and information to help the grower use precise amounts of inputs—fertilizer, pesticides, seed, and water—exactly where they are needed. I have mentioned two revolutions in agriculture in the twentieth century. First, the tractors of mechanical engineers saved the oats that horses ate. Then chemical engineers and plant breeders made more productive plants. The present agricultural revolution comes from information engineers. What do the past and future agricultural revolutions mean for land?
The agricultural production frontier remains open. On the same area, the average world farmer grows only about 20 percent of the corn of the top Iowa farmer, and the average Iowa farmer lags more than 30 years behind the state of the art of his most productive neighbor. On average the world corn farmer has been making the greatest annual percentage improvement. If during the next 60 to 70 years, the world farmer reaches the average yield of today’s U.S. corn grower, the 10 billion people then likely to live on Earth will need only half of today’s cropland. This will happen if farmers maintain on average the yearly 2 percent worldwide growth per hectare of the Food Index, slightly less than the record achieved since 1960, in other words if dynamics, social learning, continues as usual. Even if the rate slows to half, an area the size of India, more than 300 million hectares, could revert from agriculture to woodland or other uses.
Importantly, a vegetarian diet of 3,000 primary calories per day halves the difficulty or doubles the land spared. I would also observe that eating from a salad bar is like taking a sport utility vehicle to a gasoline filling station. Living on crisp lettuce, which offers almost no protein or calories, demands many times the energy of a simple rice-and-beans vegan diet. We spend more than 100 calories of fossil energy to enter 1 calorie of winter lettuce in your mouth. It takes about 10 calories of fossil energy to deliver 1 calorie of beef. We need to be careful in accepting definitions of Green.
In fact, the unnecessarily high energy cost of modern agriculture should be reduced. The energy use can be split between machines and chemicals. In energy terms, they represent about equal inputs. Most of the work of the machines goes into tillage, whose main objective is to kill weeds. Low tillage techniques are, however, improving and spreading. The basis of low-tillage techniques is the use of herbicides to control weeds, while seeds are planted by injection into the soil.
Herbicides and pesticides that now operate on the principle of carpet-bombing are moving progressively to the hormonal and genetic level, and require less and less energy as the amounts of product needed are reduced. The big slice of energy taken for fertilizers, nitrogen in particular, could be produced by grains capable directly, or through symbiosis with bacteria, of fixing nitrogen from the atmosphere. Improved tractors, low tilling, targeted herbicides and pesticides, and an extended capacity for N fixation might reduce energy consumption in agriculture by an order of magnitude.
Lifting yields while minimizing environmental fallout, farmers can offer hundreds of millions of hectares for the Great Restoration (Waggoner and Ausubel 2001). The strategy, important for foresters too, is precision agriculture. Marchetti describes it as “more bits and fewer kilowatts.”
SPREADING FORESTS
Farmers may no longer pose much threat to nature. What about lumberjacks? As with food, the area of land needed for wood is a multiple of yield and diet, or the intensity of use of wood products in the economy, as well as population and income. Let’s focus on industrial wood—logs cut for lumber, plywood, and pulp for paper.
Recurring to Reversal, consider the U.S. consumption of the four timber products: lumber, plywood and veneer, pulp products, and fuel. Between 1900 and 2000 the national use of timber products grew about 70 percent, but the preeminent feature is that the consumption of timber products rose far less than the rises in population and wealth might suggest (Wernick et al. 1998). At the end of the century, Americans numbered more than three and a half times as many as at the beginning, and an American’s average share of gross domestic product (GDP) had grown nearly fivefold. Had timber consumption risen in constant proportion to population, Americans would have consumed three and half times as much, not 70 percent more. Even more striking, if consumption had risen in proportion to economic activity or GDP, America would have consumed about 16 times as much timber each year in the 1990s as in 1900.
Industrial ecologists call a ratio of material to GDP its intensity of use. Because the annual percentage change of GDP is the sum of the changes in population and an individual’s share of GDP, a constant intensity of use means consumption is rising in step with the combined rise of population and personal GDP or income. A constant intensity of timber use would mean timber was playing the same role in the economy in 2000 as in 1990.
Practically, what changes the ratio of timber products to GDP? In the case of lumber, its replacement during the century by steel and concrete in applications from furniture and barrels to crossties and lath lowered the intensity of use. Living in the stock of existing houses and prolonging the life of timber products by protecting them from decay and fire lower it. In the case of pulp, more widespread literacy and the shift to a service economy raised the intensity of use in the early twentieth century. Thicker paper replaced thinner paper, and newspapers replaced oral gossip. More recently, thinner paper has again replaced thicker paper, and television has replaced newspapers, lowering the intensity of pulp per GDP.
Overall, history shows the extent of forests in the United States changed little in the twentieth century (Figure 3). Meanwhile, reversing hundreds of years of depletion, the volume of wood on American timberland has actually risen, by 36 percent since 1950. The main reason the forest has grown rather than shrunk is that on average a contemporary American annually consumes only half the timber for all uses as a counterpart in 1900. Meanwhile millers learned to get more product from the same tree, and foresters grew more wood per hectare. Already many areas initially cleared have regenerated, as evidenced by today’s large wooded areas in New England and the upper Great Lakes states.
Figure 3. Reversal and restoration of U.S. forests. Outer frame: U.S. forest land area, 1630-1997. Inset: U.S. forest volume, hardwoods and softwoods, 1952-1997. Sources of data: D.S. Powell, J.L. Faulkner, D.R. Darr, Z. Zhu, and D.W. MacCleery, Forest Resources of the United States, 1992, USDA Forest Service Report GTR-RM-234 (Fort Collins, Colo., USDA Forest Service, 1993). R.A. Sedjo, “Forests: Conflicting Signals,” in The True State of the Planet, edited by R. Bailey (New York: Free Press, 1995). W.B. Smith, J.L. Faulkner, and D.S. Powell, Forest Statistics of the United States, 1992, USDA Forest Service Report GTR-NC-168 (St. Paul, Minn., USDA Forest Service, 1994). W.B. Smith, 1997 RPA Assessment: The United States Forest Resource Current Situation (Washington, D.C.: USDA Forest Service, 1999).
In short, the wood “diet” required to nourish an economy is determined by the tastes and actions of consumers and by the efficiency with which millers transform virgin wood into useful products, and changing tastes and technological advances are already lightening pressure on forests. Concrete, steel, and plastics have replaced much of the wood once used in railroad ties, house walls, and flooring. Demand for lumber has become sluggish, and in the last decade world consumption of boards and plywood has actually declined. Even the appetite for “pulpwood”—logs that end as sheets of paper and board—has leveled.
Meanwhile, more efficient lumber and paper milling is already carving more value from the trees we cut. Because waste is costly, the best mills—operating under tight environmental regulations and the gaze of demanding shareholders—already make use of nearly the entire log. In the United States, for example, leftovers from lumber mills account for more than a third of the wood chips that are turned into pulp and paper; what is still left after that is burned for power. And recycling has helped close leaks in the paper cycle. In 1970, consumers recycled less than one-fifth of their paper; today the world average is double that.
The wood products industry has learned to increase its revenue while moderating its consumption of trees. Demand for industrial wood, now about 1.5 billion cubic meters per year, has risen only 1 percent annually since 1960, while the world economy has multiplied at nearly four times that rate. If millers improve their efficiency, manufacturers deliver higher value through the better engineering of wood products, and consumers recycle and replace more, in 2050 demand could be only about 2 billion cubic meters per year and thus permit reduction in the area of forests cut for lumber and paper.
The permit, as with agriculture, comes from lifting yield. The cubic meters of wood each hectare grows each year provide large leverage for change. Historically, forestry has been a classic primary industry. Like fishers and hunters, foresters for centuries hunted and fished out local resources and then moved on, returning only if trees regenerated on their own. Most of the world’s forests still deliver wood this way, with an average annual yield of perhaps 2 cubic meters of wood per hectare. If yield remains at that rate, by 2050 lumberjacks will regularly saw nearly half the world’s forests (Figure 4). That is a dismal vision—a chainsaw every other hectare, “Skinhead Earth.”
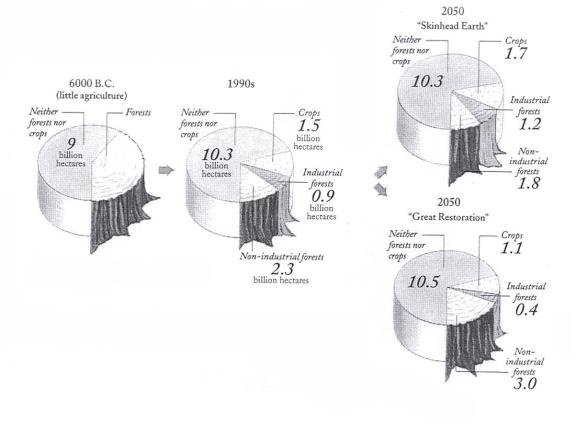
Figure 4. Present and projected land use and land cover. Today’s 2.4 billion hectares used for crops and industrial forests spread on “Skinhead Earth” to 2.9 while in the “Great Restoration” they contract to 1.5. Source: Victor and Ausubel 2000.
Lifting yields, however, will spare more forests. Raising average yields 2 percent per year would lift growth over 5 cubic meters per hectare by 2050 and shrink production forests to just about 12 percent of all woodlands—a Great Restoration (Victor and Ausubel 2001).
At likely planting rates, at least one billion cubic meters of wood—half the world’s supply—could come from plantations by the year 2050. Seminatural forests—for example, those that regenerate naturally but are thinned for higher yield—could supply most of the rest. Small-scale traditional “community forestry” could also deliver a small fraction of industrial wood. Such arrangements, in which forest dwellers, often indigenous peoples, earn revenue from commercial timber, can provide essential protection to woodlands and their inhabitants.
More than a fifth of the world’s virgin wood is already produced from forests with yields above 7 cubic meters per hectare. Plantations in Brazil, Chile, and New Zealand can sustain yearly growth of more than 20 cubic meters per hectare with pine trees. In Brazil eucalyptus—a hardwood good for some papers—delivers more than 40 cubic meters per hectare. In the Pacific Northwest and British Columbia, with plentiful rainfall, hybrid poplars deliver 50 cubic meters per hectare.
Environmentalists worry that industrial plantations will deplete nutrients and water in the soil and produce a vulnerable monoculture of trees where a rich diversity of species should prevail. Meanwhile, advocates for indigenous peoples, who have witnessed the harm caused by crude industrial logging of natural forests, warn that plantations will dislocate forest dwellers and upset local economies. Pressure from these groups helps explain why the best practices in plantation forestry now stress the protection of environmental quality and human rights. As with most innovations, achieving the promise of high-yield forestry will require feedback from a watchful public.
The main benefit of the new approach to forests will reside in the trees spared by more efficient forestry. An industry that draws from planted forests rather than cutting from the wild will disturb only one-fifth or less of the area for the same volume of wood. Instead of logging half the world’s forests, humanity can leave almost 90 percent of them minimally disturbed. And many new tree plantations are established on abandoned croplands, which are already abundant and accessible.
CONCLUSION
Because humans already number more than 6 billion and we are heading for 10 billion in the new century, we already have a Faustian bargain with technology. Having come this far with technology, we have no road back. If wheat farmers in India allow yields to fall back to the level of 1960, to sustain the present harvest they would need to clear nearly 50 million hectares, about the area of Spain.
Through further, precise intensification, farmers can be the best friends of the forest; alternatively they can plow through it. Technology can double and redouble farm yields and spare wide hectares of land for nature. I have confidence that farmers and their partners in the scientific community and elsewhere will meet the challenge of lifting yields per hectare close to 2 percent per year through the new century.
Freed and encouraged by the sparing of farmland, humanity can set a global goal of a spread in forest area of 10 percent, about 300 million hectares, by 2050. Furthermore, we should concentrate logging on about 10 percent of forestland. Behavior can moderate demand for wood products, and foresters can make trees that speedily meet that demand, minimizing the forest we disturb.
Social acceptance of the vision of the Great Restoration is key, both for farmers and for foresters. The global vision of a Great Restoration of forests that I have shared needs to be worked out in regional detail. Let’s begin in North America.
The essence of the strategy for foresters to achieve the Great Restoration is the same as that for farmers, more bits and fewer kilowatts. Call it precision forestry. Working precisely, we can spare farmland and spread forests.
Acknowledgments: Dale Langford, Cesare Marchetti, Perrin Meyer, David Victor, Paul Waggoner, and Iddo Wernick. This paper integrates work we have done together cited in the literature below.
Literature cited
AUSUBEL, J.H. 1996. Can technology spare the earth? American Scientist 84:166-178.
AUSUBEL, J.H. 2001. The great reversal: Nature’s chance to restore land and sea. Technology in Society 22:289-301.
MARCHETTI, C. 1979. On energy and agriculture: From hunting-gathering to landless farming. RR-79-10. International Institute for Applied Systems Analysis, Laxenburg, Austria.
MATHER, A.S., J. FAIRBAIRN, and C.L. NEEDLE. 1999. The course and drivers of the forest transition: The case of France. Journal of Rural Studies 15:650-690.
UN ECE/FAO. 2000. Forest resources of Europe, CIS, North America, Australia, Japan and New Zealand (industrialized temporate/boreal countries), contribution to the Global Forest Resources Assessment 2000. New York: United Nations.
VICTOR, D.G., and J.H. AUSUBEL. 2000. Restoring Forests. Foreign Affairs 79(6):127-144.
WAGGONER, P.E., and J.H. AUSUBEL. 2001. How much will feeding more and wealthier people encroach on forests? Population and Development Review 27(2):239-257.
WERNICK, I., P.E. WAGGONER, and J.H. AUSUBEL. 1998. Searching for leverage to conserve forests: The industrial ecology of wood products in the United States. Journal of Industrial Ecology 1(3):125-145.
ABOUT THE AUTHOR
Jesse Ausubel is director of the Program for the Human Environment, The Rockefeller University, New York City.
Email: ausubel@mail.rockefeller.edu
web: https://phe.rockefeller.edu