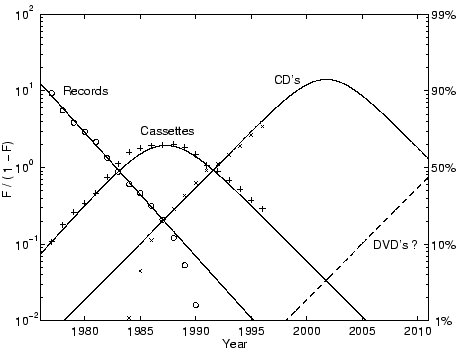
Rather than using regression, we can specify the parameters for a logistic. This is useful when few or no data are available, as is the case for new technologies seeking to be market leader.
Continuing with the example of recording media, we consider a
prospective competitor to follow CD's: the digital versatile disk, or
DVD, which has the same size as a CD with about 10 times the storage
capacity. We used Loglet Lab to estimate the
![]() and
and
![]() that characterize the speed and span of the rise of LP's,
cassettes, and CD's; based on these numbers, we could estimate on our
own similar values of
that characterize the speed and span of the rise of LP's,
cassettes, and CD's; based on these numbers, we could estimate on our
own similar values of
![]() and
and ![]() for DVD's. We chose
a
for DVD's. We chose
a
![]() of 13 years and a
of 13 years and a ![]() of 2012 to generate Figure
11, which shows how the new competitor would affect the
market that we had presented in Figure 10.
of 2012 to generate Figure
11, which shows how the new competitor would affect the
market that we had presented in Figure 10.
|
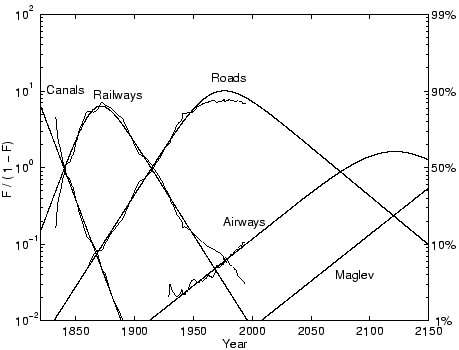
Figure 12 shows the example of competition and substitution among canals, rails, roads, airways, and a possible competitor, maglevs5. Here, market share is the length of existing canals, rails, roads, and air routes, not unit sales. This figure also demonstrates familiar competitors (modes of transportation) over a much longer time span than the recording media example and increases the competitors to five. The estimated rates of change of kilometers of each competitor and of the whole American transportation infrastructure illuminate the forces at work. This history of substitution begins in the era of the Erie Canal and extends a century and half into the future.