Citation: European Review 6 (2): 143–162 1998
Keywords: maglev, transportation, energy, logistic substitution, time budgets
Areas of Research: Cities and Transportation
Summary:
We envision a transport system producing zero emissions and sparing the surface landscape, while people on average range hundreds of kilometers daily. We believe this prospect of ‘green mobility’ is consistent in general principles with historical evolution. We lay out these general principles, extracted from widespread observations of human behavior over long periods, and use them to explain past transport and to project the next 50 to 100 years. Our picture emphasizes the slow penetration of new technologies of transport adding speed in the course of substituting for the old ones in terms of time allocation. We discuss serially and in increasing detail railroads, cars, aeroplanes, and magnetically levitated trains (maglevs).
Introduction
Transport matters for the human environment. Its performance characteristics shape settlement patterns. Its infrastructures transform the landscape. It consumes about one-third of all energy in a country such as the United States. And transport emissions strongly influence air quality. Thus, people naturally wonder whether we have a chance for ‘green mobility’, transport systems embedded in the environment so as to impose minimal disturbance.
In this paper we explore the prospect for green mobility. To this end, we have sought to construct a self-consistent picture of mobility in terms of general laws extracted from widespread observations of human behavior over long periods. Here we describe this picture and use the principles to project the likely evolution of the transport system over the next 50 to 100 years.
Our analyses deal mostly with averages. As often emphasized, many vexing problems of transport systems stem from the qualities of distributions, which cause traffic jams as well as costly empty infrastructures. 1 Subsequent elaboration of the system we foresee might address its robustness in light of fluctuations of various kinds. Although the United States provides most illustrations, the principles apply to all populations and could be used to explain the past and project the future wherever data suffice.
General travel laws and early history
Understanding mobility begins with the biological: humans are territorial animals and instinctively try to maximize territory. 2,3,4The reason is that territory equates with opportunities and resources.
However, there are constraints to range — essentially, time and money. In this regard, we subscribe to the fundamental insights on regularities in household travel patterns and their relationships gained by Zahavi and associates in studies for the World Bank and the US Department of Transportation in the 1970s and early 1980s. 5,6,7,8
According to Zahavi, since ever and in contemporary societies spanning the full range of economic development, people average about 1 hour per day traveling. This is the travel time budget. Schafer and Victor, who surveyed many travel time studies in the decade subsequent to Zahavi, find the budget continues to hover around one hour. 9 Figure 1 shows representative data for studies of the United States, the state of California, and sites in about a dozen other countries since 1965. We take special note of three careful studies done for the city of Tokyo as well as one averaging 131 Japanese cities. 10 Although Tokyo is often mentioned as a place where people commute for many hours daily, the travel time budget proves to be about 70 minutes, and the Japanese urban average is exactly one hour. Switzerland, generally a source of reliable data, shows a 70 minute travel time budget. 11
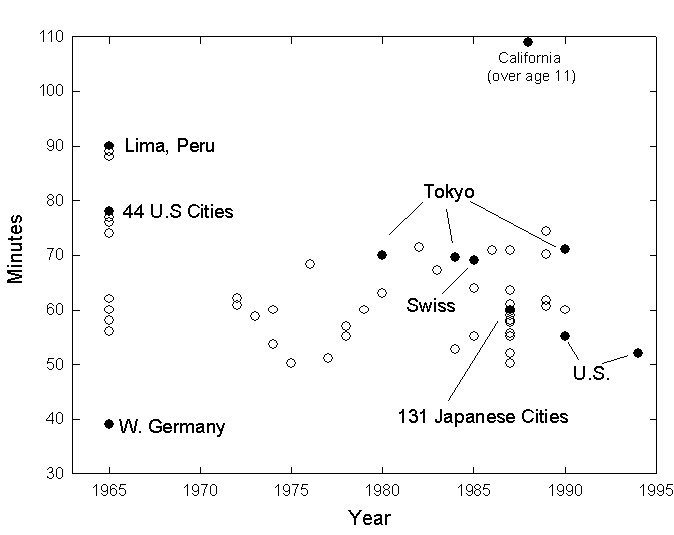
Figure 1 . Travel time budgets measured in minutes of travel per person per day, sample of studies. Sources of data: Katiyar and Ohta 10, Ofreuil and Salomon8,, Szalai et al. 14, US Department of Transportation 33,34, Wiley et al .12,, Balzer 13. Other data compiled from diverse sources By Schafer and Victor 9.
The only high outlier we have found comes from a study of 1987-1988 activity patterns of Californians, who reported in diaries and phone surveys that they averaged 109 minutes per day travelling. 12 The survey excluded children under age 11 and may also reflect that Californians eat, bank, and conduct other activities in their cars. If this value signaled a lasting change in lifestyle to more travel rather than bias in self-reporting or the factors just mentioned, it would be significant. But, a study during 1994 of 3,000 Americans, chosen to reflect the national population, including people aged 18-90 in all parts of the country and economic classes, yielded transit time of only 52 minutes. 13 After California, the next highest value we found in the literature is 90 minutes in Lima, where Peruvians travel from shantytowns to work and markets in half-broken buses.
We will assume for the duration of this paper that one hour of daily travel is the appropriate reference point in mobility studies for considering full populations over extended periods. Variations around this time likely owe to diverse survey methods and coverage, for example, in including walking or excluding weekends, or to local fluctuations. 14
Why 1 hour more or less for travel? Perhaps a basic instinct about risk sets this budget. Travel is exposure and thus risky as well as rewarding. MacLean reports evolutionary stability in the parts of the brain that determine daily routine in animals from the human back to the lizard, which emerges slowly and cautiously in the morning, forages locally, later forages farther afield, returns to the shelter area, and finally retires. 15 Human accident rates measured against time also exhibit homeostasis. 16
The fraction of income as well as time that people spend on travel remains narrowly bounded. The travel money budget fluctuates between about 11% and 15% of personal disposable income (Table 1).
Table 1. Travel expenditures, percent of disposable income, various studies. Sources Of Data: Eurostat 40, UK Department of Transport 41, Schafer and Victor 9, Central Statistics Office 42, US Bureau of the Census 21,28, Zahavi 5; Institut National De La Statistique et des Etudes Economiques 43.
| Country | Year | Percent of Income Spent on Travel |
|---|---|---|
| United States | 1963-1975 | 13.2 |
| 1980 | 13.5 | |
| 1990 | 12.1 | |
| 1994 | 11.4 | |
| United Kingdom | 1972 | 11.7 |
| 1991 | 15.0 | |
| 1994 | 15.6 | |
| West Germany | 1971-1974 | 11.3 |
| 1991 | 14.0 | |
| France | 1970 | 14.0 |
| 1991 | 14.8 | |
| 1995 | 14.5 |
The constant time and money budgets permit the interpretation of much of the history of movement. Their implication is that speed, low-cost speed, is the goal of transport systems. People allocate time and money to maximize distance, that is, territory. In turn when people gain speed, they travel farther, rather than make more trips.
‘Speed’ means inclusive speed, like Darwin’s inclusive fitness. It spans the time from when the traveler leaves home to when she or he walks in the office, for example, including minutes spent waiting for a bus or searching for parking.
On average, people make 3-4 trips per day, rich or poor. 8,17Hupkes asserts a ‘Law of Constant Trip Rates’ as well as travel time. 18 The 3-4 trips per day matter, because they limit the main round trip to 40-50 minutes. Thus, what most people use or access daily is what can be reached in 20 minutes or so.
Passenger fluxes switch by an order of magnitude when crossing the 20-minute boundary. For example, in the old days ferries in Hong Kong between Victoria and Kowloon took about 60 minutes and carried about 300,000 people per day, operating at 30% capacity. When tunnels opened a few years ago, requiring only 5-10 minutes for the underwater crossing, traffic soared to 2 million crossings per day, shocking all the planners. 19 New bridges traversible in minutes have multiplied local traffic ten times in Lisbon and five times in Istanbul.
Just as people average 3-4 round trips per day, they also average 3-4 trips per year outside their basic territory. Trip frequency falls off fast with distance, that is, with travel time. A German even now takes on average one air flight per year. 20 At the height of the rail era, an American took one rail trip each year. 21
Also, people mostly travel to meet people. Of American travel time, about 30 percent is to work, 30 percent for shopping and child care, 30 percent for free-time activities, and the remainder for meals out and other personal care. 22 Moreover, travel is home-centered. In fact, life is home-centered (Figure 2). People spend 2/3 of their time indoors at home. Surprisingly, Californians, for all their avowed love of nature, spend only about 90 minutes each day outside. 12As mentioned earlier, exposure is felt as dangerous. Home-centered trips occupy about 90% of all travel time.
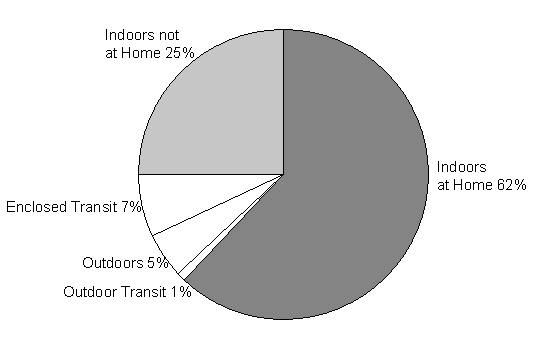
Figure 2 . Percent of time spent in major locations by Californians. Source of data: Wiley et al .12
People also want to return nightly to their home beds. About 60% of all air trips in Europe are businessmen who make a same day return. Given the height of European airfares, these travelers could surely afford to spend the night at their destination, but the gravity of home pulls powerfully.
Given the abiding budgetary laws, why does transport have a dynamic history? While the human brain and thus the time budget may not have changed in a million years, the money budget has, usually upward. During the past 200 years personal income has risen steeply.
With growing wealth, technology introduces faster means. The new modes are faster, but usually not cheaper, especially at the outset, so travelers do not rush to use them. Rather the new means gradually capture the market, as people can afford more, come to be familiar with how a new system operates, and as the system itself improves in many dimensions. The picture is slow penetration of new technologies of transport adding speed in the course of substituting for the old ones in terms of time allocation. Figure 3 shows the story for the United States. US per capita mobility has increased 2.7% per year, with walking included. Excluding walking, Americans have increased their mobility 4.6% each year since 1880. The French have increased their mobility about 4% per year since 1800. 23 We note that the development and diffusion of communication technologies have not lessened the urge to travel or its realization. In fact, better telecommunications systems enable more and faster travel.
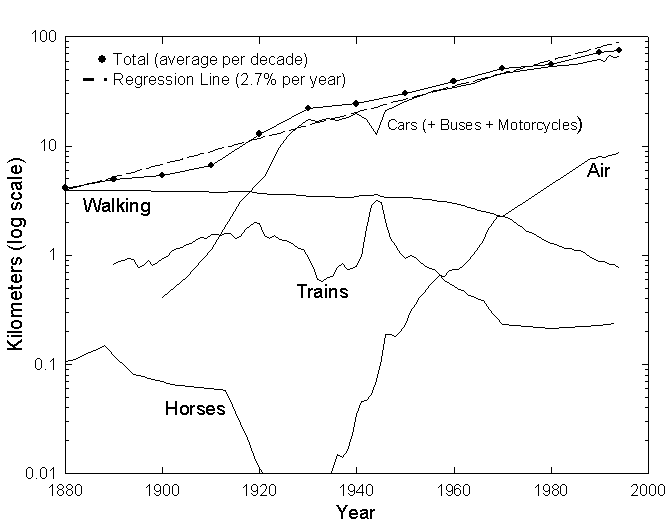
Figure 3 . US passenger travel per capita per day by all modes.
Sources of data: Grubler 23, US Bureau of the Census 21,28, US Department of Transportation 33,35.
Thinking about the evolution of mobility naturally begins with our feet. We used to walk 5 km per day, and now Americans walk perhaps 1 km. In France, mechanical mobility equalled walking only during the 1920s. 23 We walk about 5 km/hour. Walking 5km/hour for 1 hour gives a radius of 2.5 km and an area of 20km 2, the distances which define a village. In fact, the area that can be traversed in one hour with prevailing modes of transport functionally defines a city.
Although tiring, running is three to four times faster than walking and quite reliable for the able-bodied. High speed lasts only an hour or two. The Incas sustained a large empire for centuries on foot, with the furthest outposts 2 weeks from the center for the relay runners.
The wheel greatly enhanced the foot. The wheel multiplies our ability to move goods an order of magnitude over dragging material on poles. Even today human rickshaws carry freight and passengers in Calcutta and elsewhere.
Horses can run faster and longer than people. They can sustain 20 km per hour for several hours per day and reach a speed of 50 km per hour for a few minutes. Horses topped transport for a few thousand years. They made big empires for the Romans, Chinese, and Huns.
Horses also greatly expanded personal territory. The horse, of course, is the image of the American West. Horses were cheap in the United States because they did not compete with people for land for food. In effect, they established the low price of a gallon of gasoline in the United States. The vast American West was quickly divided into territories controlled by ranchers, farmers, and ‘Indians’, all with horses. The story of the village and the Western range show that spatial organization is homothetical to speed available, for all creatures.
Even in the United States, France, and other industrializing countries, horses kept their lead until the middle of the 19 thcentury. Munching hay and oats, horses did 70% of the work in the United States until about 1900. In 1920 America still stabled 20 million non-farm horses, which also produced about half a million tons per day of effluent.
Trains (commercialized about 1830) and motor cars (first produced in the 1890s) displaced horses. 24 Figure 4 shows how canals (on whose tow-paths horses and mules pulled the barges), rails, roads, and airways have successively occupied shares of the overall length of the US transport infrastructure, enabling the sequence of moving technologies. The steady substitution fits closely with a model based on growth and decline following the S-shaped logistic equation. 25 Depiction of the rates of growth of the infrastructure reveals a rhythm to its history peaking in intensity every 50-60 years and gives us confidence for prediction (Figure 5). Let us now discuss serially and in increasing detail the characteristics of the market leaders: railroads, cars, and aeroplanes, and their destined successor, magnetically levitated and driven trains (maglevs).
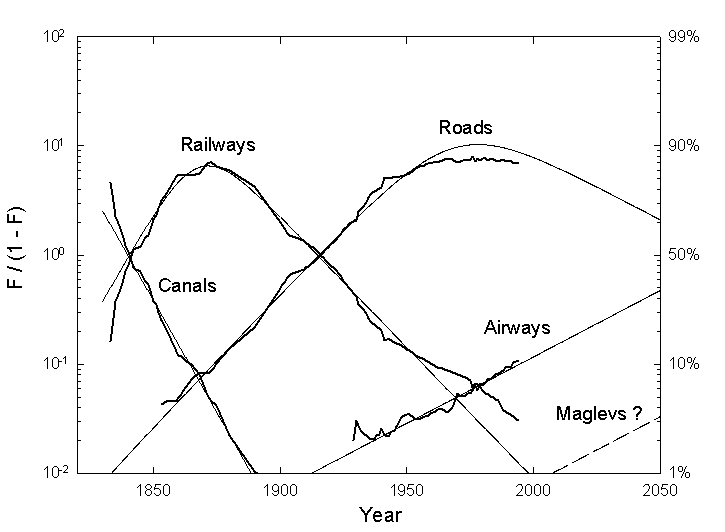
Figure 4 . Shares of the actual total length of the US transport infrastructure (squiggly lines) analyzed with the logistic substitution model (smooth lines). F is the fraction of total length or the market share. The logarithmic scale in the ordinates renders the S-shaped logistic linear. Sources of data: Gruebler 23, US Bureau Of The Census 21,28, US Department Of Transportation 33,34.
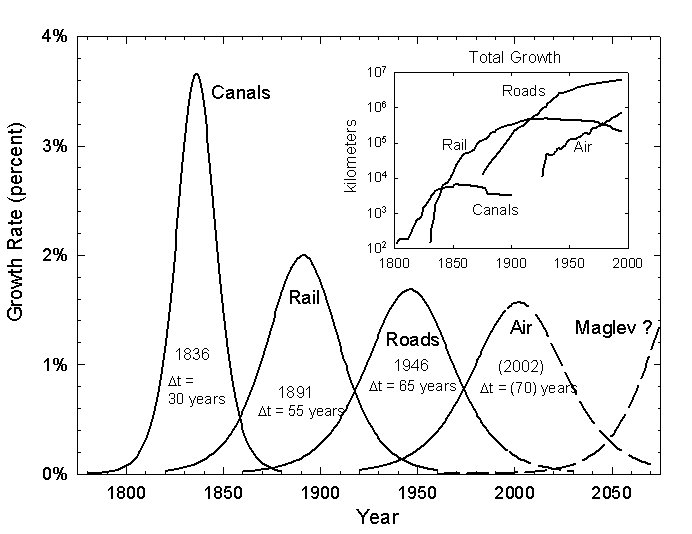
Figure 5 . Smoothed historic rates of growth (solid lines) of the major components of the US transport infrastructure and conjectures (dashed lines) based on constant dynamics. The inset shows the actual growth, which eventually became negative for canals and rail as routes were closed. Delta t is the time for the system to grow from 10% to 90% of its extent. Sources of data: Gruebler 24, US Bureau of the Census 21,28, US Department Of Transportation 33,37.
Railroads
This history of trains emphasize that the roadbed as well as the vehicle changes. The Romans employed a large workforce in making and placing paving stones. In time, we have had wood, cast and wrought iron, and steel rails. On smooth rails, trains required low force (low energy) to pull them and could carry great loads. Low friction also meant high speed.
High speed unified countries. Riding the rails, Garibaldi and Bismarck conducted the formation of Italy and Germany. In the United States the rails ended the functional independence of the States and created the chance to integrate many more. The Golden Spike joining the Pacific and Atlantic rail networks at Promontory Point in Utah in 1869 recognized the unification of the continental United States.
Wood first fired trains. The demand on forests for fuel and ties cleared vast acreages and caused fears of timber famine, even in the United States. 26 Trains could not fulfill their maximum role until coal fuel became widely available, although creosote and other preservatives lessened structural wood demand. Coal’s energy density doubled that of wood, and thus system range and flexibility. Belching coal smoke from steam locomotives became the sooty symbol of travel. In fact, at the time of the break-up of the USSR coal to power the railroads still formed almost half the cargo of the Soviet railroads. Diesel-fueled electric locomotives again doubled the range and halved the emissions of coal and steam. System-wide electrification eliminated the need to carry fuel and centralized the emissions. In France, cheap, smokeless nuclear electricity has helped the train, sometimes ‘a grand vitesse’ (TGV), retain a niche in the passenger transport system.
Although we may think of trains as fast, in practice their inclusive speed has always been slow, because of travel to and from the stations, changes, stops, and serpentine routes. Today European intercity trains still average only about 60 km/hour, measured as air distance between stops. German trains, perceived as efficient, average 65 km/hour with a peak of only 95 km/hour. A TGV may reach 400 km/hour on its rails, but inclusive speed is perhaps half this value.
Trains as we know them today will thus form a small part of future transport. Their slow inclusive speed limits them to low-value cargoes. Making money is easier flying an express letter for $20 than hauling a ton of soybean meal 1500 km by rail from Illinois to Connecticut for the $20. For passengers, the TGVs should probably concentrate on the 200 km range, where a one-hour trip time appears convenient for business travel, and especially on even shorter segments. For the latter, the high speed could quadruple the base territory of daily personal round-trips for working and shopping that the car offers.
Shrinking the present slow rail infrastructure will continue to cause pain, especially in Europe, where it remains pervasive. In France in 1995 the prospect of closing some almost unused rural spurs nearly brought down the government.
Cars
Compared to railroads, cars have the great advantages of no waiting time and no mode change, offset in some places by parking shortages. One could say cars have infinite frequency.
In practice, cars are about eight times as fast as pedestrians. Their mean speed is about 40-50 km/hour, combining inter and intra city. Public vehicles such as buses go about 20 km/hour, or 10 km/hour in midtown Manhattan.
Expanding in linear space 8 times, one acquires about 60 times the area. Cars thus expand territory from about 20 km 2for the pedestrian to about 1200 km 2 for the licentiates. Sixty villages become one town. The car effectively wipes out two levels in the former hierarchy of settlements in which, in Christaller’s classic formulation, clusters of seven (pedestrian) villages support a town, which in turn joins with six other towns to support a city. 27 The car thus reshuffles 60% of the population into larger urban areas.
Because 90% of all passenger kilometers occur within the territorial niche established by the daily travel budgets, the size of the personal niche matters greatly. Eighty percent of all mileage is currently traveled within 50 km of home.
The car is a personal prosthesis, the realization of the “Seven League Boots” that enabled the wearer to cover about 35 km in each step in the fairy story ‘Hop o’ my Thumb’. Although late adopters of new technologies consistently saturate lower than pioneers, car populations seem to saturate at a car for each licensable driver. 23 Perhaps the proportion will rise somewhat as more people acquire second homes.
In the United States, the annual average distance a car travels has remained about 9-10,000 miles since 1935. 21,28The time a car works each day has also remained about 1 hour, so the average speed of a car has stayed constant at about 40 km/hour. Because per capita daily car travel time also does not change with income but stays at just under an hour, gasoline taxes take a larger share of earnings from those who earn less.
Since the 1920s cars have set the tone for travel fuel. Americans now use about 1.5 gallons of gasoline per person daily for travel, the largest single use of energy. In the past 50 years, motor fuel consumption in the United States has multiplied fivefold to about 150 x 10 9 gallon per year, while motor vehicle kilometers multiplied sevenfold. Therefore, fuel economy increased less than 1% per year, although classes of cars show decadel intervals of as much as a 2% per year efficiency rise.
Motor vehicles remain energetically inefficient, so the scope for reducing per car consumption is large. With the numbers of cars saturating in the developed countries and constant driving time and vehicle size, motor fuel consumption in these countries will tend to decrease, with the rate contingent on population change. Inspection of the total passenger kilometers traveled in various modes (Figure 6) confirms that the car (and bus) travel market, while huge, provides little opportunity for growth in fuel deliveries. In the United States, the rise of population at about 1% per year continues to offset roughly the efficiency gains. The taste for large personal ‘sport’ and ‘utility’ vehicles also demands more fuel but will level and perhaps pass. In Europe and Japan, where populations are imploding, market saturation and rising efficiency will shrink car fuel consumption. To sell more energy, oil companies will surely try to market more natural gas and electricity in coming decades.
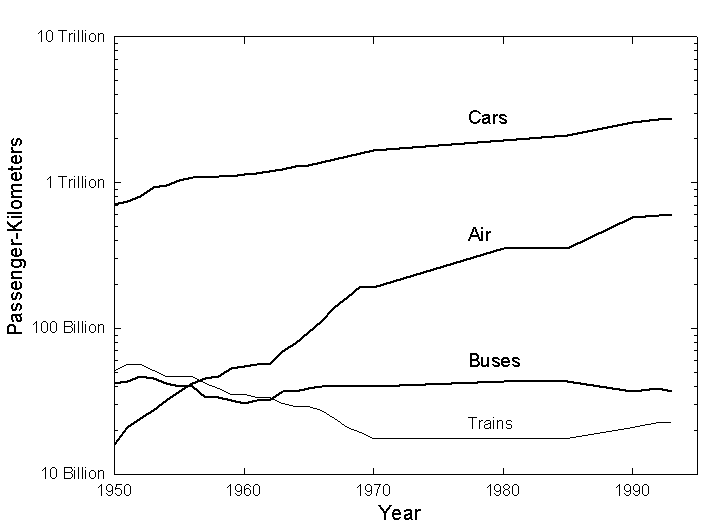
Figure 6 . US domestic intercity passenger travel. Sources of data: US Bureau Of The Census 21,28.
In any case, the population of personal vehicles will remain very large. In the United States it will likely grow from about 200 to about 300 million during the 21 stcentury, as the number of Americans heads for 400 million. Environmentally, the one-license one-car equation means that each car on average must be very clean. Incremental efficiency gains to internal combustion engines will not suffice. The alternative of three hundred million large batteries made with poisonous metals such as lead or cadmium also poses materials recycling and disposal problems.
The obvious answer is the zero-emission fuel cell, where compressed hydrogen gas mixes with oxygen from the air to give off electric current in a low-temperature chemical reaction that also makes water. If refining is directed to the making of hydrogen, its cost should resemble that of gasoline. Moreover, the electrochemical process of the fuel cell is potentially 20%-30% more efficient than the thermodynamic process of today’s engines, an efficiency in line to be attained by the middle of the next century (Figure 7). Daimler-Benz, Ford, and other vehicle manufacturers are already building prototype cars powered by fuel cells. 29 Daimler-Benz plans to begin to penetrate the market within 10 years starting at about 100,000 cars per year. Because of the large, lumpy investments in plant required, the traditional ten-year lifetime of cars, and gradual public acceptance, it will take two to three more decades before the fuel cell cars dominate the fleet. City air, now fouled mostly by cars, could be pristine by the year 2050.
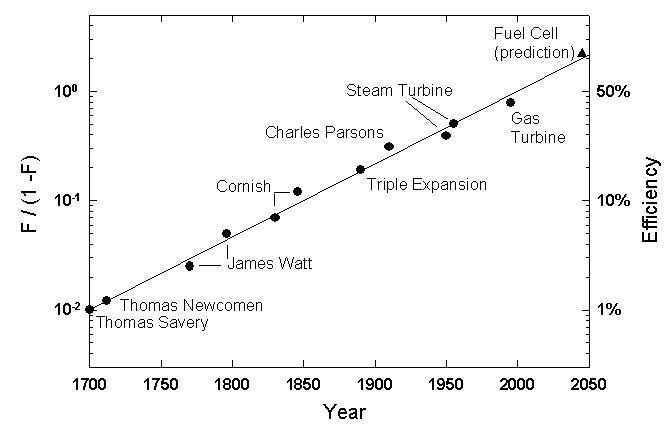
Figure 7 . Improvement in the efficiency of motors analyzed as a sigmoid (logistic) growth process, normalized to 100% of what appears achievable from the actual historic innovations, which are shown. Seventy percent efficient fuel cells, which are theoretically attainable, are due in 2050. After Ausubel and Marchetti 35.
Aeroplanes
Trains and cars seek smooth roadbeds. Flying finesses the problem by smoothing Earth itself, elevating to levels where the mountains and valleys do not interfere. 30 (Marine shipping similarly reduced friction and smoothed coastlines and other terrestrial impediments. For an eccentric exposition, see Ref 30.) For animals, flying is energetically cheaper than running, but requires extremely sophisticated design. Flying has a high fixed energy cost, because support is dynamic. One must push air down to stay up. Energy cost thus depends on time in flight and penalizes slow machines.
So, the successful machines tend to be fast. The mean speed of a plane is 600 km per hour with takeoff and landing, an order of magnitude faster than the intercity trains.
During the past 50 years passenger kilometers for planes have increased by a factor of 50. Air has increased total mobility per capita 10% in Europe and 30% in the United States since 1950. A growth of 2.7% per year in passenger km and of the air share of the travel market in accord with the logistic substitution model brings roughly a 20-fold increase for planes (or their equivalents) in the next 50 years for the United States and even steeper elsewhere. Figure 8 shows the airways heading for half the US market in intercity travel around 2025.
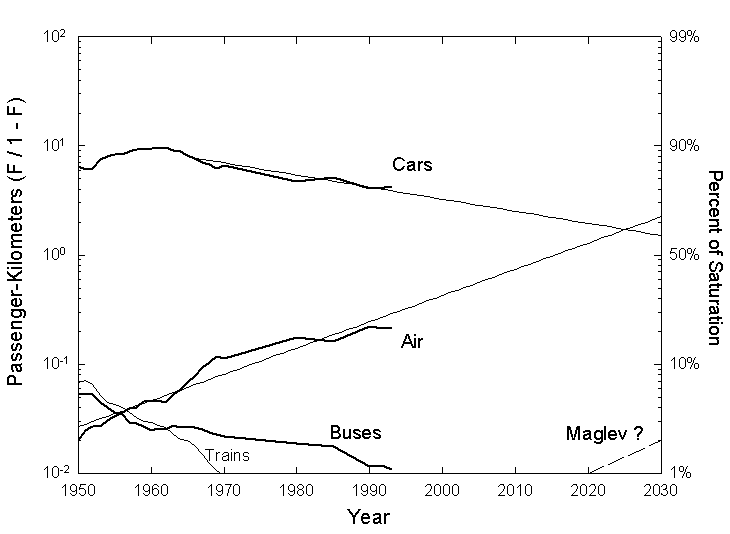
Figure 8 . Shares of actual US domestic intercity passenger travel (squiggly lines) analyzed and extrapolated with the logistic substitution model (smooth lines). The scale used renders the S-shaped logistic linear. Sources of data: US Bureau of the Census 21,28.
Europeans currently travel at about 35 km/hour (or per day, because people travel about 1 hour per day). Of this, Europeans fly only about 15 seconds or 2.5 km per day. A continuing rise in mobility of 2.7% per year means doubling in 25 years, and an additional 35 km per day or about 3 minutes on a plane. Three minutes per day equal about one round-trip per month per passenger. Americans already fly 70 seconds daily, so 3 minutes certainly seems feasible for the average European a generation hence. The jet set in business and society already flies a yearly average of 30 minutes per day. The cost in real terms of air transport is decreasing, so a larger stratum could allocate some share of its money budget to this mode. However, for the European air system the projected level requires a 14-fold increase in the next 25 years or about 12% per year, a hard pace to sustain without a basic rethinking of planes and airport logistics.
One bottleneck is the size of the aeroplanes. Boeing 747s now carry two-thirds of air passenger traffic (in km). The 50-fold increase in traffic has come with a very small increase in the fleet. For a long time the number of commercial aeroplanes was stable around 4000, and in recent years increased to about 5500, many of which are old and small. Nevertheless, commercial productivity in passenger kilometres/hr has soared. Compared with the Queen Mary, a marine alternative for crossing the Atlantic taken out of service in 1967 when the Boeing 747 was about to be introduced, the Jumbo Jet had three times the productivity in passenger km per hour, the same engine power and cost, and 1/100 the crew and weight. The B-747 outperformed its predecessor planes, the B-707 and the DC-8 of the 1950s and 1960s by one order of magnitude and the DC-3 of the 1930s by two orders. To achieve a further order of magnitude growth, the air system requires a 1000-1200 passenger 0.8 Mach plane now and a jumbo hypersonic (greater than Mach 5) soon.
Freight compounds the pressure. Planes started by carrying only the mail and a few pricey people. They have progressively captured lower value goods. (Railroads also started this way and now carry essentially only coal and grain. The declining market for coal will further diminish rail, in turn limiting coal. We wonder how the grain will get around.) Freight still accounts for only 15% of air ton km, so much potential growth remains in the system. The largest air freighter now carries 200 tons. With an increase in traffic, airframe companies will design a variety of planes for freight. One thousand tons seem technically portable. Air freighters could in fact revolutionize cargo transport and reduce the role of the road in long-distance distribution of goods.
As implied, top planes can meet the productivity need in part with greater speed and size. The super- and hyper-sonic machines can work well for intercontinental travel, but at the continental range, noise and other problems arise, especially in the 500-1000 km distances which separate many large continental cities. A single route that carries one million passengers per year per direction, or 30,000 per day, would require 60 take-offs and landings of Jumbos, a lot to add on present airports. Moreover, in our outlook, aeroplanes will consume most of the fuel of the transport system, a fact of interest to both fuel providers and environmentalists. Today’s jet fuel will not pass the environmental test at future air traffic volumes. More and more hydrogen needs to enter the mix and it will, consistent with the gradual decarbonization of the energy system (Figure 9). Still, we clearly need a high density mode having the performance characteristic of top aeroplanes without the problems.
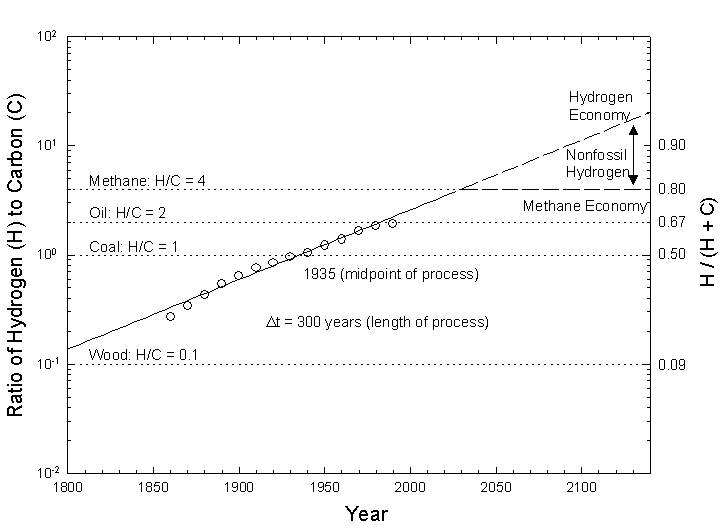
Figure 9 . Ratio of hydrogen (H) to carbon (C) for global primary energy consumption since 1860 and projections for the future, expressed as ratio of hydrogen to carbon (H/(H+C)). The ratio is analyzed as a sigmoidal (logistic) growth process, and is plotted on a scale that renders the S-shaped logistic linear. The projection shows two scenarios: one for a methane economy in which the ‘average’ fuel stabilizes at the H/C ratio of natural gas, and one for a hydrogen economy, in which hydrogen produced by the separation of water using nuclear or solar power would eventually fully decarbonize the energy system. Source: Ausubel 44.
Maglevs
According to our rhythmic historical model (Figure 5), a new, fast transport mode should enter about 2000. The steam locomotive went commercial in 1824, gasoline engine in 1886, and jet in 1941. In fact, in 1991, the German Railway Central Office gave the magnetic levitation system a certificate of operational readiness and a Hamburg-Berlin line is now under construction. 31,32 Maglev prototypes have run up to 600 km/hour.
Maglevs have many advantages: not only high mean speed, to which we will recur, but acceleration, precision of control, and absence of noise and vibration 33,34,. They can be fully passive to forces generated by electrical equipment and need no engine on board. Maglevs also provide the great opportunity for electricity to penetrate transport, the end-use sector from which it has been most successfully excluded.
While resistance limits speed, the induction motors that propel maglevs do not. These motors can produce speeds in excess of 800 km/hour and in low pressure tunnels thousands of km per hr. In fact, electromagnetic linear motors have the capacity to exert pull on a train independent of speed. A traditional electric or internal combustion engine cannot deliver power proportional to speed. In contrast, the new motors allow constant acceleration. Constant acceleration maglevs (CAMs) could accelerate for the first half the ride and brake for the second and thus offer a very smooth ride with high accelerations.
Linear motors can absorb high power, gigawatts for a 100-ton train approaching the centre of its trip. 35 Because the power demand constantly goes from such levels to zero in a matter of minutes, the system places a heavy strain on the electric grid. But, a technical fix may exist. Distributing an energy storage system along the line could largely solve the problem of power. The constant pull force means constant energy per unit distance. The system would store the energy recovered from braking trains locally and re-deliver it to accelerating trains. Recovery could be quite good with linear motors. High-temperature superconductors in fact could permit almost complete energy recovery in deceleration as well as hovering at zero energy cost. The external grid would provide only, on a quasi-continuous basis, the make-up for the losses due to trains, motors, and storage, which could be based on magnetic storage coils in the ground. Such storage systems need research.
High speed does entail problems: aerodynamic and acoustic as well as energetic. In tunnels, high speed requires large cross sections. The neat solution is partially evacuated tubes, which must be straight to accommodate high speeds. Low pressure means a partial vacuum comparable to an altitude of 15 thousand meters. Reduced air pressure helps because above about 100 km per hour the main energy expense to propel a vehicle is air resistance. Low pressure directly reduces resistance and opens the door to high speed with limited energy consumption. Tunnels also solve the problem of landscape disturbance.
For a subsurface network of maglevs, the cost of tunneling will dominate. The Swiss are actually considering a 700 km system. 36 For normal high-speed tunnels, the cross-section ratio of tunnel to train is about 10-1 to handle the shock wave. With a vacuum, however, even CAMs could operate in small tunnels, fitting the size of the train. In either case the high fixed cost of infrastructures will require the system to run where traffic is intense–or huge currents can be created, that is, trunk lines. Because the vehicles will be quite small, they would run very often. In principle, they could fly almost head-to-tail, ten seconds apart.
Acceleration might be limited to 0.5 G or 5 m/s 2, the same as a Ferrari or Porsche (a person feels 1 G lying down on a bed, but the vector is different). In fact, present maglev designs go up to 3 m/s 2. The Six Flags Magic Mountain Amusement Park in Valencia, California, USA is operating a high-tech roller coaster, ‘Superman: The Escape’, 37with a linear induction motor whose cars accelerate passengers with a force up to 4.5 G. Within a couple of seconds the thrill seekers hurtle upward at 160 km per hour. Such playful implementations of maglev technology can be an important signal of public acceptance.
Initially, maglevs will likely serve groups of airports, a few hundred passengers at a time, every few minutes. They might become profitable at present air tariffs at 50,000 passengers per day.
In essence maglevs will be the choice for future Metros, at several scales: urban, possibly suburban, intercity, and continental.
As the Hong Kong tunnel and Lisbon bridge suggest, the key to traffic development is to switch a route functionally from intercity to intracity. If the Channel Tunnel transit time, London-Amsterdam or London-Paris, were to drop to 20 minutes, traffic could rise an order of magnitude, assuming also the fading of the frontier effect, which strongly reduces traffic between cultures. Our picture is small vehicles, rushing from point to point. The comparison is with the Internet — a stream of data is broken down into addressed packets of digits individually switched at nodes to their final destination by efficient routing protocols.
Alternately, the physical embodiment resembles, conceptually, that of particle accelerators, where ‘buckets’ of potential fields carry bunches of charged particles. Maglevs may come to be seen as spin-offs of the physics of the 1970s and 1980s, as transistors are seen as realizations of the quantum mechanics of the 1920s and 1930s.
With maglevs, the issue is not the distance between stations, but waiting time and mode changes, which must be minimized. Stations need to be numerous and trips personalized, that is, zero stops or perhaps one.
Technically, among several competing designs the side-wall suspension system with null-flux centering, developed in the United States by the Foster-Miller company, seems especially attractive: simple, easy access for repair, and is compact. 38 Critically, it allows vertical displacement and therefore switches with no moving parts.
The suspension system evokes a comparison with air. Magnetic forces achieve low-cost hovering. Planes propel by pushing air back. Momentum corresponds to the speed of the air pushed back, that is, energy lost. Maglevs do not push air back, but in a sense push Earth, a large mass, which can provide momentum at negligible energy cost. The use of magnetic forces for both suspension and propulsion appears to create great potential for low travel-energy cost, conceptually reduced by 1-2 orders of magnitude with respect to energy consumption by aeroplanes with similar performance.
Because maglevs carry neither engines nor fuel, the weight of the vehicle can be light and total payload mass high. Aeroplanes at takeoff, cars, and trains all now weigh about 1 ton per passenger transported. A horse was not much lighter. Thus, the cost of transport has mainly owed to the vehicle itself. Maglevs might be 200 kg per passenger. Heavy images of trains and planes continue to haunt discussions of maglevs. In eventual practice, a very light envelope suspended on a moving magnetic field modeled with a computer will surely have very different characteristics from a classic train.
For the intracity maglev, metro stations might be spaced 500 meters apart, with very direct access to trains. Vertical displacement can be precious for stations, where trains would pop up and line up, without pushing other trains around. It also permits a single network, with trains crossing above or below. Alternatively, a hub-and-spoke system might work. This design favors straight tubes and one change.
In Paris, a good Metro city, access to Metro stops is about 5 min on foot, leaving 15-20 min for waiting and travel. Our wagon navigating in a magnetic bucket at 0.5 G constant acceleration could cover 10 km in 1.5 min at a mean speed of 400 km/hour. The trip from Wall Street to midtown Manhattan might be 1 min, while from Heathrow Airport to central London might be 2-3 min. For CAMs transit time grows as the square root of distance, so 500 km might take 10 min and 2500 km 20 min.
Suburban maglevs might go 500 km per hour, a speed requiring 30 s to attain at 0.5 G. At current city densities, this could create functional agglomerations with a 100 km radius and perhaps 150 million people. Stations would serve about 10,000 people.
For the city or suburban model to work, the Internet model is particularly important: information packets called humans sent by a common carrier, starting from various sources and avoiding jams by continuous rerouting. Elevators in busy skyscrapers already prefigure the needed optimization routines.
At intercity and continental scale, maglevs could provide supersonic speeds where supersonic planes cannot fly. For example, a maglev could fuse all of mountainous Switzerland into one functional city in ways that planes never could, with 10 minute travel times between major present city pairs. Alternately, maglevs could functionally expand the area of a city. In fact, settlements seem to be evolving both at micro and macro in the direction of linear or edge cities or corridors, formed by transport and foreseen more than a generation ago in the “ecumenopolis”. 39 This pattern seems well-served by maglevs.
Will CAMs make us sprawl? This is a legitimate fear. In Europe, since 1950 the tripling of the average speed of travel has extended personal area tenfold, and so Europe begins to converge with Los Angeles. The car enlarges the cities but also empties the land. In contrast to the car, maglevs may offer the alternative of a bimodal or ‘virtual’ city with pedestrian islands and fast connections between them.
In a city such as Paris people live in their quarter and regularly or occasionally switch to other quarters. This actual behavior suggests a possible form for future human settlements. ‘Quarters’ could grow around a maglev station with an area of about 1 km 2and 100,000 inhabitants, be completely pedestrian, and via the maglev form part of a more or less vast network providing the majority of city services at walking distance. Quarters need not be contiguous, an architecture inherited from the early pedestrian city, but could be surrounded by green land.
Travelling in a CAM at 0.5 G for 20 minutes, a woman in Miami could go to work in Boston and return to cook dinner for her children in the evening. Bostonians could symmetrically savor Florida, daily. Marrakech and Paris could pair, too. With appropriate interfaces, the new trains could carry hundreds of thousands of people per day, saving cultural roots without impeding work and business in the most suitable places.
Seismic activity could be a catch. In areas of high seismic activity, such as California, safe tubes (like highways) might not be a simple matter to design and operate.
Although other catches surely will appear, maglevs should displace the competition. Intrinsically, in the CAM format they have higher speed and lower energy costs and could accommodate density much greater than air. They could open new passenger flows on a grand scale during the 21 stcentury with zero emissions and minimal surface structures.
Closing Remarks
All the history of transport reduces to the fundamentally simple principle: produce speed technically and economically so that it can be squeezed into the travel money budget. The history of transport technology can be seen as a striving to bring extra speed to the progressively expanding level of income.
By the year 2100, per capita incomes in the developed countries could be very high. A 2% growth rate, certainly much less than governments, central banks, industries, and laborers aspire to achieve, would bring an average American’s annual income to $200,000.
Time, or convenience, determines the volume of traffic. Traffic will be very high if we stay within the traditional budgets, even higher if the relaxation of time budgets permits an increase in travel time, which Californians may foreshadow, or if the share of disposable income allocated to travel trends upward.
Staying within present laws, a 2.7% per year growth means doubling of mobility in 25 years and 16 times in a century.
A century or more is the rational time for conceiving a transport system. The infrastructures last for centuries. They take 50-100 years to build, in part because they also require complementary infrastructures. Railroads needed telegraphs, and paved roads needed oil delivery systems so that gasoline would be available to fill empty car tanks. Moreover, the new systems take 100 years to penetrate fully at the level of the consumer. Railroads began in the 1820s and peaked with consumers in the 1920s.
Fortunately, during the next century we may be able to afford green mobility. In fact, we can clearly see its elements: cars, powered by fuels cells; aeroplanes, powered by hydrogen; and maglevs, powered by electricity, probably nuclear. The future looks clean, fast, and green.
Acknowledgments:
Thanks to the late Robert Herman for many stimulating conversations about travel and behavior, Arnulf Gruebler and Nebojsa Nakicenovic for sharing their analyses of these same questions with us over many years, Eduard Loeser and Andreas Schafer for help with data, and Chauncey Starr and Kurt Yeager for their continuing interest in our work.
References
1R. Herman (1982) “Remarks on Traffic Flow Theories and the Characterization of Traffic in Cities”. In W. C. Schieve, and P. M. Allen (eds.), Self-Organization and Dissipative Structures (Austin, Texas: University of Texas) pp. 260-284.
2R. Ardrey (1986) The Territorial Imperative (New York: Atheneum).
3R. D. Sack (1986) Human Territoriality: Its Theory and History (Cambridge UK: Cambridge University Press).
4C. Marchetti (1994) “Anthropological invariants in travel behavior”. Technological Forecasting and Social Change 47(1), 75-88.
5Y. Zahavi (1976) “Travel characteristics in cities of developing and developed countries”. World Bank Staff Working Paper No. 230, World Bank, Washington, DC.
6Y. Zahavi (1979) The “UMOT” Project. US Department of Transportation Report No. DOT-RSPA-DPD-20-79-3, Washington, DC.
7Y. Zahavi (1981) ‘Travel time budgets in developing countries’. Transportation Research Part A-General 15(1), 87-95.
8Y. Zahavi, M. J. Beckmann, and T. F. Golob (1981) The UMOT/Urban Interactions. US Department of Transportation Report No. DOT-RSPA-DPB-10/7, Washington, DC.
9A. Schafer and D. G. Victor (1997) ‘The Future Mobility of the World Population’. Discussion Paper 97-6-4, Massachusetts Institute of Technology, Center for Technology , Policy, and Industrial Development, Cambridge, MA.
10R. Katiyar and K. Ohta (1993) ‘Concept of daily travel time (DTT) and its applicability to travel demand analysis’. Journal of the Faculty of Engineering of the University of Tokyo 42(2), 109-121.
11Verkehrsverhalten in der Schweiz 1984 (1986) GVF-Bericht 2/86, Bern, Switzerland.
12J. A. Wiley, J. P. Robinson, T. Piazza, K. Garrett, K. Cirksena, Y. T. Cheng, and G. Martin (1991) Activity patterns of California residents , California Survey Research Center, University of California, Berkeley.
13H. Balzer (1995) Report on daily Activities of Americans , NPD Group Inc., Rosemont, IL, 1995 (see also https://www.npd.com); reported in New York Times , 6 September 1995, p. C1.
14A. Szalai, P. E. Converse, P. Feldheim, E. K. Scheuch, and P. J. Stone (1992) The Use of Time: Daily Activities of Urban and Suburban Populations in 12 Countries (The Hague, Netherlands: Mouton).
15P. D. MacLean (1990) The Triune Brain in Evolution: Role in Paleocerebral Functions (New York: Plenum).
16J. G. U. Adams (1990) Transport Planning: Vision and Practice , (London: Routledge & Kegan Paul).
17J. P. Ofreuil and I. Salomon (1993) ‘Travel patterns of the Europeans in everyday life’. A Billion Trips a Day – Tradition and Transition in European Travel Patterns (Amsterdam: Kluwer Academic).
18G. Hupkes (1988) “The law of constant travel time and trip rates”, Futures 14(1), 38-46.
19C. Marchetti (1991) “Building bridges and tunnels: The effects on the evolution of traffic”. In A. Montanari (ed), Under and Over the Water: The Economic and Social Effects of Building Bridges and Tunnels (Napoli, Italy: Edizione Scientifiche Italiane), pp. 189-278.
20International Air Transport Association (IATA) (1995) World Air Transport Statistics, Cointrin-Geneva.
21US Bureau of the Census (1975) Historical Statistics of the United States: Colonial Times to 1970 (Washington, DC: US Government Printing Office).
22J. P. Robinson and G. Godbey (1997) Time For Life: The Surprising Ways Americans Use Their Time (University Park, Pennsylvania: Pennsylvania State University).
23A. Gruebler (1990) The Rise and Fall of Infrastructure: Dynamics of Evolution and Technological Change in Transport (Heidelberg: Physica).
24K. Desmond (1987) The Harwin Chronology of Inventions, Innovations, and Discoveries from Pre-History to the Present Day (London: Constable).
25N. Nakicenovic (1998) “Dynamics and replacement of US transport infrastructures”. In J. H. Ausubel and R. H. Herman (eds), Cities and Their Vital Systems: Infrastructure Past, Present, and Future (Washington, DC: National Academy), pp. 175-221.
26S. H. Olson (1971) The Depletion Myth: A History of Railroad Use of Timber (Cambridge, Massachusetts: Harvard).
27W. Christaller (1933) Central Places in Southern Germany (Englewood Cliffs, New Jersey: Prentice-Hall).
28US Bureau of the Census (1996 and earlier years) Statistical Abstract of the U.S. (Washington, DC: US Government Printing Office).
29P. Hoffman (1997) Hydrogen & Fuel Cell Letter XII(4), 14 April.
30N. Rashevsky (1968) Looking at History Through Mathematics
(Cambridge, Massachusetts: MIT).
31MVP (Versuchs- und Planungsgesellschaft für Magnetbahnsysteme m.b.H) (1997 Die offizielle Transrapid Homepage, URL https://www.mvp.de/, Munich, Germany.
32J. Mika, Transrapid Informations Resourcen Homepage , URL https://transrapid.simplenet.com/, Germany.
33US Department of Transportation (1997) National Transportation Library: High Speed Ground Transportation (Washington, DC: Bureau of Transportation Statistics). Online at URL https://www.bts.gov/ntl/.
34US Department of Transportation (1997) National Transportation Statistics 1997 (Washington, DC: Bureau of Transportation Statistics). Online at https://www.bts.gov/btsprod/nts/.
35J. H. Ausubel and C. Marchetti (1996) ‘Elektron’, Daedalus 125, 139-169.
36M. Jufer (1996) Swissmetro: Wissenschaftliche Taetigkeit der ETH-Lausanne und Zuerich, Hauptstudie-Zwischenbericht Juli 1994-Juni 1996 (Switzerland: ETH-Lausanne), 30 August 1996. URL https://sentenext1.epfl.ch/swissmetro.
37Superman: The Escape (1997) Superman: The Escape Ride Specs Page , URL https://www.sixflags.com/parks/sfmm, Six Flags Theme Park Inc., Valencia, CA.
38US Department of Transportation (1993) Compendium of Executive Summaries from the Maglev System Concept Definition Final Reports , DOT/FRA/NMI-93/02, pp. 49-81, March 1993. On-line at https://www.bts.gov/smart/cat/CES.html.
39C. A. Doxiadis (1974) Anthropolis: City for Human Development (New York: Norton).
40Eurostat (1994) Consumer Expenditure Survey Data, personal communication to A. Schafer (MIT), Luxembourg.
41UK Department Of Transport (1993) National Travel Survey , London.
42Central Statistics Office (1996) Annual Abstract of Statistics (London: Her Majesty’s Statistics Office).
43Institut National De La Statistique Et Des Etudes Economiques (INSEE) (1997) Annuaire Statistique De La France Edition 1997 (Paris.)
44J. H. Ausubel (1996) ‘Can technology spare the Earth?’ American Scientist 84(2), 166-178.