Citation: Pollution Prevention Review 8 (1): 39–52 1998 This article has been republished in the journal Environmental Regulation and Permitting 9(2):251-62, 1999.
Keywords: business, efficiency, energy, decarbonization, agricultural yields, water use, material flows
Areas of Research: Technology & Human Environment
Efficiency will win
In this article, I would like to share some surprising insights into the long-term evolution of the human environment and technology that may help diverse industries to do their jobs better. Indeed, absorbing some of these insights may determine which firms survive.
My points are: Demand for many primary products, or natural resources, will drop, in the USA and other important markets. In other words, efficiency will win. Pollution will plummet. Many firms’ emissions already have. We are going to live on a green planet with abundant land for nature.
As will become evident, these developments are not discontinuities or revolutions. Rather, the wheels of history are rolling in the direction of prudent, clean use of resources. Those who understand the dynamics can make money from them, too.
Usually we hear from environmental scientists and activists about deforestation, loss of arable land, water scarcity, and exhaustion of hydrocarbon fuels. The trumpets blare that, a population grows from six to 10 billion over coming decades, humans will demand so much of everything that prices will rocket, squabbles over access to resources will turn to wars, and a bath of pollution will burn us all.
In contrast, I believe that society is a learning system – and that we have been learning to become much more efficient. Pollution and waste usually indicate inefficiency. In an economy of competing companies, inefficiency is for losers. So, over the long run, successful companies are going to be green and clean.
A tour of the major natural resources – energy, land, water, and materials – justifies my confidence. Accordingly, this article surveys the trends in the use of these resources over the last century or two, globally and in the United States.
Along the way, it is important to keep in mind three paramount facts about the economy:
- Evolution is a series of replacements. Products, performers (usually companies), and technologies substitute for one another in the market in a search for inclusive fitness.
- The struggle is bloody. Products, performers, and technologies, indeed whole systems of doing things, lose and die.
- The struggle is episodic or cyclical, in many instances. In particular, long cycles or pulses of about 50 years punctuate the evolution of the economy. We happen to be at the start of a new cycle now.
Energy
Gains in energy productivity and efficiency astonish. Consider the gains for motors and lamps, pictured in Exhibit 1 on a logarithmic scale as the fraction of the limit of efficiency they might obtain. In about 1700, the quest began to build efficient engines, starting with steam. Three-hundred years have increased the efficiency of the generators from one percent to about 50 percent of their apparent limit, the latter achieved by today’s best gas turbines, made by General Electric. Fuel cells, which will power our cars in 20 to 30 years, can advance apparent efficiency to about 70 percent.
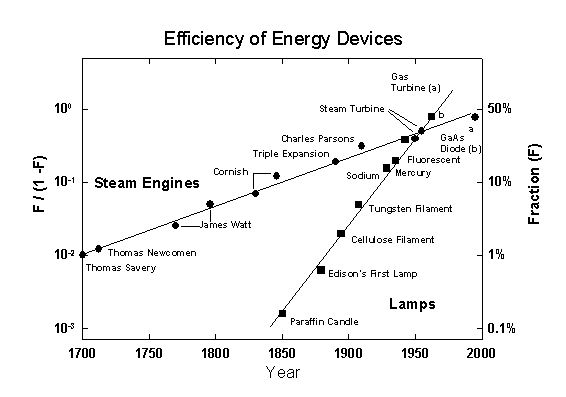
The efficiency data for engines and lamps are plotted along a line fitted by a logistic equation. The scale used renders the conventional S-shaped curve of the logistic equation into a straight line. Source: Ausubel and Marchetti, Daedalus 125(3), 1996.
Lamps have brightened with each decade. At the outset of the 1990s, the Photonics Lab of the 3M Company announced an advance in short-wavelength solid-state light emitters in the blue and green spectral regions using zinc-selenium lasers. These could significantly advance efficiency, penetrating the market for displays and then reaching into other commercial applications.
Analyses of the evolving efficiency of the full energy system show that the United States has averaged about one percent less energy to produce a good or service each year since about 1800. However, our modern economies still probably run at only about five-percent efficiency for the full chain from extracting primary energy to delivery of the service to the final user. Fifty-percent efficiency at each of four links in a chain, after all, produces six-percent efficiency for the chain as a whole.
For the environment, efficiency with respect to use and leaks of carbon matters greatly. Carbon darkens the environmental outlook by threatening oily beaches, smoggy air, overheated climate, and black lungs. Happily, the most important single fact to emerge from 20 years of energy analyses is the gradual “decarbonization” of the energy system, the falling number of carbon molecules used to provide a unit of energy or economic product.
In 1860, globally, about 1.1 tons of carbon went into the primary energy produced by the energy equivalent of one ton of oil then in the fuel mix; the amount has decreased monotonically to about 0.7 tons in 1990. Exhibit 2 details the shrinking carbon used for final energy to the consumer in diverse countries in the last few decades. Efficiency is much higher in the richer countries, whose firms more readily discern inefficiency as a market opportunity and can parlay the expertise and capital to reduce it.
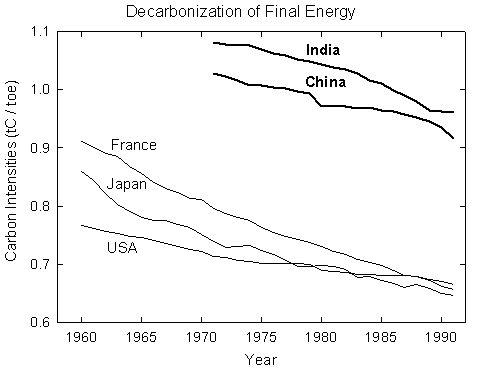
Source: Nakicenovic, Daedalus 125(3), 1996.
This decarbonization partly reflects that new motors and light bulbs get more out of the fuel they use. It also reflects the substitution of fuels that are progressively lighter in carbon. I noted above that evolution is a series of replacements. In fact, we can view the process of decarbonization as the replacement of carbon with hydrogen as the source of chemical energy (see Exhibit 3). Economizing on carbon, we are on a steady trajectory toward a methane, and eventually hydrogen, economy.
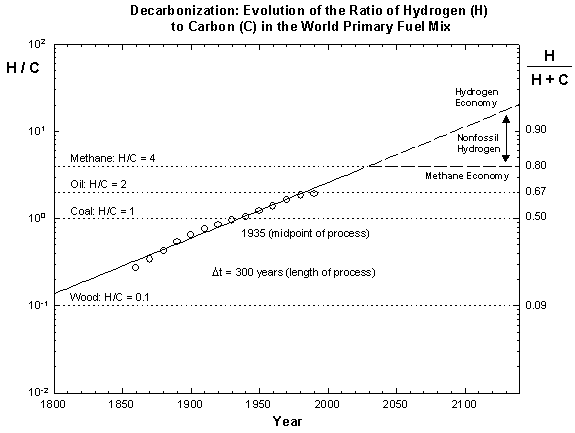
The ratio of H to C is plotted along a line fitted by a logistic equation. The scale used renders the conventional S-shaped curve of the logistic equation into a straight line.
Source: Ausubel, American Scientist, March-April 1996.
A grand substitution of leading energy sources has taken place over the past century and a half for the world: from wood and hay, to coal, to oil, and now to natural gas. “Oil” companies such as Shell and Mobil affirm it in the investments they now favor. The progression of fuels has sequentially supported a higher spatial density of consumption. Effectively, each new leading fuel is superior from an environmental point of view.
Wood and hay, prevalent at the start of the 19th century, were bulky and awkward. Consider if every high-rise resident needed to keep both a half-cord of wood at hand for heat and a loft of hay for the Honda. Think of the deforestation this would cause – directly for the fuelwood, and indirectly from the land needed for hay.
Coal had a long run at the top, notwithstanding its devastating effects on miners’ lungs and lives, urban air, and the land from which it came. Then, around 1900, the advantages of a system of fluids rather than solids became evident. Coal-powered autos never had much appeal. The weight and volume of the fuel were hard problems.
Oil has a higher energy density than coal, plus the advantage of a form that allows it to flow through pipelines and into tanks. Systems of tubes and tins can deliver carefully regulated quantities from the scale of the engine of a motor car to that of the Alaska Pipeline. But transfer between tins is imperfect, and the tubes and tins puncture. The spills make headlines.
In contrast, an inconspicuous, pervasive, and efficient system of pipes distribute natural gas. Its capillaries safely reach right to the kitchen. For gas, the next decades will be a time of relative and absolute growth. Gas is the penultimate fuel, the best until hydrogen, whose combustion product is water rather than carbon dioxide. Nuclear plants remain the best long-run candidate to manufacture the hydrogen, but perhaps solar will learn to compete.
Before making “neat” hydrogen, the next step is “zero emission power plants” with supercompact, superpowerful, superfast turbines that deliver what are now combustion products in a form appropriate for injection into aquifers where they can be sequestered forever. Very high pressure CO2 gas turbines in which combustion of the fuel with oxygen inside the gas flux provides the heat should do the trick.
Looking back, we see that growth of per capita energy consumption has been keyed to cleaner fuels (see Exhibit 4). Pulses of energy growth reach economic, social, technical, and environmental limits. In past pulses, per capita energy consumption tripled before the energy services desired outgrew the old fuels or portfolio of fuels. I postulate two new global pulses, one centered on gas and then a later one centered on hydrogen. Industrial, commercial, and residential end users have also enjoyed two neatly quantifiable pulses of penetration of electricity, and two more probably lie ahead, keyed to the information revolution and later to the electrification of travel.
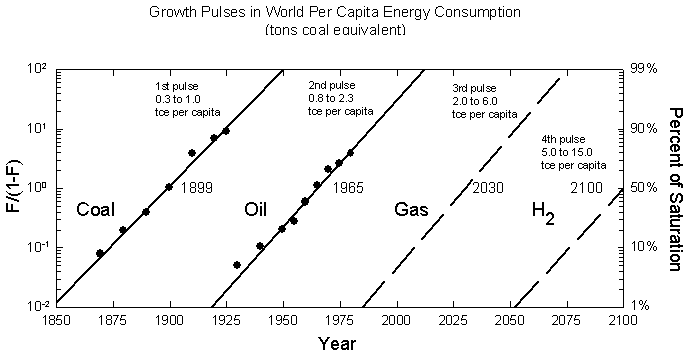
Total world consumption is dissected into a succession of logistic curves, again plotted on a scale that renders each S-shaped pulse into a straight line.
Source: Ausubel et al., Climatic Change 12(3):245-263, 1988.
The growth pulses, lasting 40 to 45 years, are followed by lulls or depressions of a decade or two in energy consumption. These years between the pulses, when demand is rather flat, matter greatly for industry organization because they especially reward producers who are the most efficient and lowest cost – in short, the most competitive. They often witness a big restructuring of the industry, as is happening today to electric utilities.
Global triplings of demand need not mean triplings in the U.S. and other rich countries, where higher efficiencies throughout the chain can effectively supply the already amply, but still sloppily, provided end-users.
To return to the environmental aspect, recall that the transport system mirrors the energy system. In personal transport, oil substituted for hay (that is, cars for horses). America had more than 20 million non-farm horses in 1910 and has about 200 million motor vehicles today. Imagine the pollution had the fleet stayed equine. So the energy story is efficiency and cleanliness to meet the demands of larger, denser markets, driven by competition, occurring in long cycles.
Land
More blood spills over land than any other resource. Yields per hectare measure the productivity of land and the efficiency of land use. During the past half century, ratios of crops to land for the world’s major grains – corn, rice, soybeans, and wheat – have climbed, fast and globally.
A cluster of innovations, including tractors, seeds, chemicals, and irrigation – joined through timely information flows and better organized markets – raised yields to feed billions more without clearing new fields.
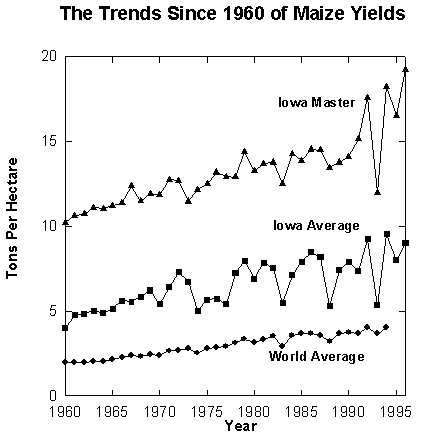
Per hectare, world grain yields rose 2.15 percent annually between 1960-1994. The productivity gains have stabilized global cropland since mid-century, mitigating pressure for deforestation in all nations and allowing forests to spread again in many. The Green Revolution that led to high-yield crops earned a Nobel Peace Prize. The alternative – extending farming onto hundreds of millions more hectares – would surely have evoked deadly strife.
Fortunately, as Exhibit 5 shows, the agricultural production frontier remains spacious. On the same area, the average world farmer grows only about 20 percent of the corn of the top Iowa farmer, and the average Iowa farmer lags more than 30 years behind the state-of-the-art of his most productive neighbor.
Source: Waggoner, Daedalus 125(3), 1996.
Will high-yield agriculture tarnish the land? Farmers do many things on each area of land that they crop. In general, higher yields require little more clearing, tilling, and cultivating than lower yields. Protecting a plot of lush foliage from insects or disease requires only a little more pesticide than does sparse foliage. Keeping weeds from growing in deep shade beneath a bumper crop may require less herbicide per field than keeping them from growing in thin shade. The amount of water consumed is more or less the same per area whether the crop is abundant or sparse. Growing higher yields distills away only a little more water and leaves only a little more salt than lower yields.
Seed is planted per plot; choosing a higher yielding variety does not affect the surroundings. If the improved variety resists pests, it lessens the external effects of pesticides compared to a sprayed crop. By minimally changing the external effects of things that farmers do per area, lifting yields will thus lower effects per unit of yield.
On the other hand, farmers use more of some things to raise the yield of their crops. For example, farmers apply more fertilizer, especially nitrogen, per plot to raise yields. But in fact the key issue is usually the sound, complementary use of fertilizer and water. We appear to have reached the point of diminishing returns for applications of fertilizer. In America, use has been level for 15 years. Globally, use has fallen since 1985, in part because of big drops in the former Soviet bloc, where it was wastefully applied.
Globally, the future lies with precision agriculture. This approach to farming relies on technology and information to help the grower use precise amounts of inputs – fertilizer, pesticides, seed, water – exactly where they are needed. Precision agriculture includes grid soil sampling, field mapping, variable rate application, and yield monitoring, tied to global positioning systems. It helps the grower lower costs and improve yields in an environmentally responsible manner. At a soybean seminar in Dayton covered by the Associated Press on February 10, 1997, Ohio farmers reported using one-third less lime after putting fields on square-foot satellite grids detailing which areas would benefit from fertilizer.
We have had two revolutions in agriculture in this century. The first came from mechanization. The second came from agricultural chemicals. The next agricultural revolution will come from information.
If during the next 60 to 70 years, the world farmer reaches the average yield of today’s U.S. corn grower, 10 billion people will need only half of today’s cropland while being able to consume the same number of calories as Americans eat today. This will happen if we maintain the yearly 2.15% worldwide yield growth of grains achieved during 1960-1994. Even if the rate falls by half, an area the size of India, globally, will revert from agriculture to woodland or other uses. The bottom line is that farm land should become more abundant in many countries. Land prices should show it.
Water
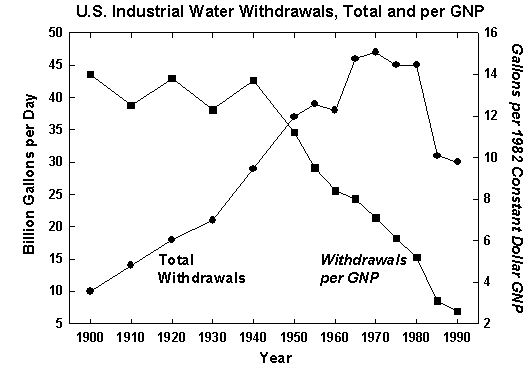
Will water become scarce? Not if we similarly squeeze more value from each drop. Since 1975, per capita water use in the United States has fallen at an annual rate of 1.4 percent. Even absolute water withdrawals peaked about 1980.
Industry, alert to technology as well as costs, exemplifies the progress, although it consumes a small fraction of total water. Total U.S. industrial water withdrawals plateaued about 1970, and have since dropped by one-third (see Exhibit 6). Also interesting is that industrial withdrawals per unit of GNP have dropped steadily since 1940. Then, 14 gallons of water flowed into each dollar of output. Now the flow is less than three gallons per dollar.
The steep decline taps many sectors, including chemicals, paper, petroleum refining, steel, and food processing, and also reflects changes in what forms the economy. After adjusting for production levels, not only intakes but discharges per unit of production are perhaps one-fifth of what they were 50 years ago in the United States.
Sources of Data: U.S. Historical Statistics, U.S. Statistical Abstract
Technology, law, and economics have all favored frugal water use. Better management of demand reduced water use in the Boston area from 320 million gallons per day in 1978 to 240 million gallons in 1992. Incidentally, more efficient use of water and energy usually go together, through better heat-exchangers and recirculation of cooling water. And, if land used for farming shrinks, water use will also tend to fall, although the fraction that is irrigated will rise.
Despite the gains, the United States is far from the most efficient practices. Water withdrawals for all users in the OECD countries range tenfold, with the United States and Canada the highest. Allowing for national differences in the major uses (irrigation, electrical cooling, industry, and public water supply), large opportunities for reductions remain. Like enterprises supplying energy or inputs to farmers, enterprises treating and supplying water will find the emphasis in their markets on quality, not quantity.
Materials
We can reliably project more energy from less carbon, more food from less land, and less thirst with less water. What about more goods and services with less material? Let us define such a “dematerialization” as the decline over time in the weight of materials used to perform a given economic function.
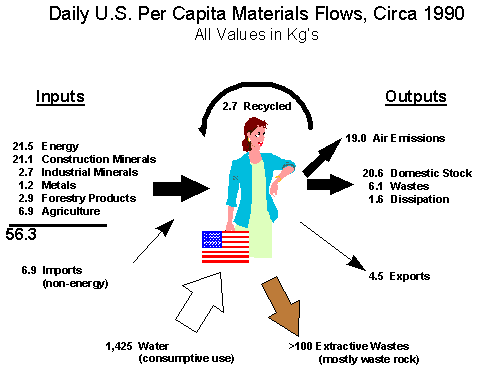
Dematerialization would matter enormously for the environment. Excluding water and oxygen, in 1990 on average each American mobilized more than 50kg of materials per day (see Exhibit 7). Lower materials intensity of the economy could preserve landscapes and natural resources, lessen garbage, and reduce human exposures to hazardous materials.
Source: Wernick and Ausubel, Ann. Rev. of Energy and Environment, 1995.
Over time, new materials substitute for old. Successful new materials usually show improved properties per ton, thus leading to a lower intensity of use for a given task. The idea is as old as the epochal succession from stone to bronze to iron. In the United States, the present century has witnessed the relative decline of lumber and the traditional metals and the rise of aluminum and especially plastics (see Exhibit 8).
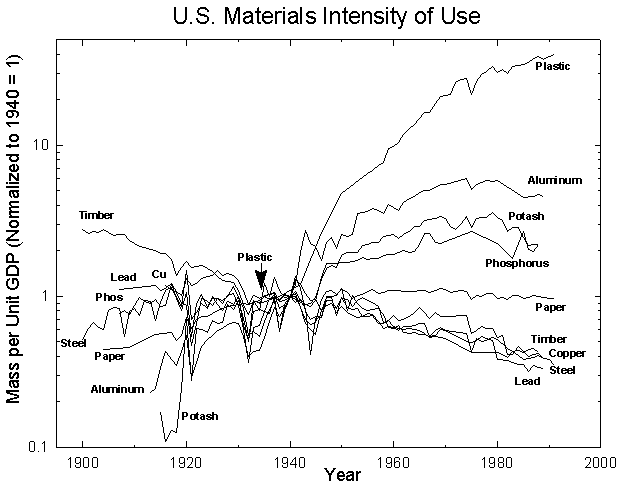
The yearly U.S. consumption in mass of the materials is divided by the yearly constant dollar GDP and, to ease comparison, normalized to 1940 (that is, 1940 = 1 for every material).
Source: Wernick et al., Daedalus 125(3), 1996.
Modern examples of dematerialization abound. Since the early 19th century, the ratio of weight to power in industrial boilers has decreased almost 100 times. Within the steel industry, powder metallurgy, thin casting, ion beam implantation and directional solidification, as well as drop and cold forging, have allowed savings up to 50 percent of material inputs in a few decades.
In the 1970s, a mundane invention, the radial tire, directly lowered weight and material by one-quarter compared to the bias-ply tire it replaced. An unexpected and bigger gain in efficiency came from the doubling of tire life by radials – thus halving the use of material (and the piles of tire carcasses blighting landscapes and breeding mosquitoes).
Lightweight optical fibers – with 30 to 40 times the carrying capacity of conventional wiring, greater bandwidth, and invulnerability to electromagnetic interference – are ousting copper in many segments of the telecommunications infrastructure. Similarly, the development of high fructose corn syrup (HFCS) in the 1960s eliminated sugar from industrial uses in the United States. HFCS sweetens five times more than sugar on a unit weight basis, with a proportional impact on agricultural land use.
Certainly many products – for example, computers and containers – have become lighter and often smaller. A few compact discs weighing ounces and selling for less than $100 now contain 100 million phone numbers of Americans, equivalent to the content of telephone books formerly weighing tons and costing thousands. Or you can obtain the numbers from the Internet.
In containers, at mid-century, glass bottles dominated. In 1953 the first steel soft-drink can was marketed. Cans of aluminum, one-third the density of steel, entered the scene a decade later, and by 1986 garnered more than 90 percent of the beer and soft drink market. Between 1973 and 1992, the aluminum can itself lightened 25 percent. In 1976 polyethylene terephthalate (PET) resins began to win a large share of the market, especially for large containers previously made of glass. Once again, for businesses, efficiency meant opportunity, and substitutions meant life and death.
Recycling, of course, diminishes the demand for primary materials and may thus be considered a form of dematerialization. During the past 25 years, recycling and resource recovery have become generalized, albeit incipient, social practices. The basic idea is that wastes are wastes and should be eliminated.
Difficulties arise in the more complex “new materials society” in which the premium lies with sophisticated materials and their applications. Alloys and composites with attractive structural properties can be hard to separate and recycle. Popular materials can be lighter, but bulkier or more toxic. Reuse of plastics may be less economical than burning them (cleanly) for fuel or otherwise extracting their chemical energy.
Most important, economic and population growth have multiplied the volume of products and objects. Thus, total materials consumed and disposed have tended to increase, while declining per unit of economic activity.
Wood products provide an illuminating case. Does doubling the number of people or the amount of wealth double the use of products taken from the forest? We can shed light on this proportionality (or elasticity, as the economists might say) by dissecting historic growth in demand. This growth is the product of an identity: population multiplied times GDP per person multiplied times wood product per GDP.
Consider the U.S. consumption of timber products – lumber, plywood and veneer, pulp products, and fuel (Exhibit 9). Between 1900 and 1993, the national use of timber products grew 70 percent. Large features of these 93 years include the big growth of pulp – that is, paper and paperboard – while the consumption of lumber rose little. Fuel wood nearly disappeared, and then re-emerged. And plywood consumption emerged but remained small. The preeminent feature is that the consumption of timber products rose far less than the rises in population and wealth might suggest.
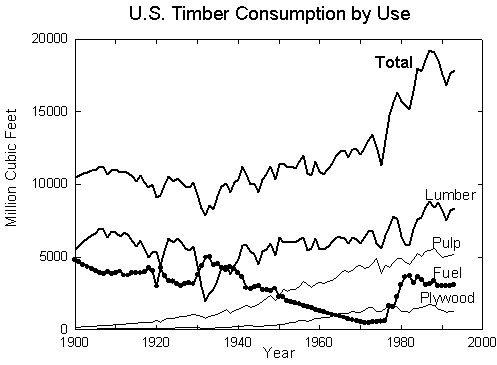
Source: Wernick et al., Journal of Industrial Ecology 1(3):125-145, 1997.
Near the end of the century, Americans numbered more than three and a half times as many as at the beginning, and an American’s average share of GDP had grown nearly five fold. Had a strict proportionality prevailed, Americans would have consumed 16 times as much timber in 1993 as in 1900, rather than 1.7 times.
The explanation for the difference lies in the third term of the identity mentioned above: the product consumed per unit of GDP (for example, pulp/GDP). Industrial ecologists call this parameter “intensity of use.” If intensity of use is constant, consumption will rise in unchanging proportion to the combined rise of population and wealth. If thicker paper replaces thinner paper and newspapers replace oral gossip, then intensity of use lifts consumption faster than population plus wealth. If thinner paper replaces thicker paper and television replaces newspapers, this lowers the intensity of pulp used per unit of GDP.
Five ten-year periods illustrate the power of intensity of use: the periods 1900-1909 and 1984-1993 bracket the century; in between, 1925-34 shows the decline into the Depression, 1936-45 the recovery and war, and 1973-82 the oil shock.
The segments of the bars in the upper panel of Exhibit 10 show the annual change of the components determining demand, and the unsegmented bars in the lower panel show their sum. For the timber product paper, represented by the consumption of the raw material pulp, the upper panel shows the growth of population gradually slowing from about 2% per year to less than 1% per year and the GDP per person fluctuating through business cycles. The pulp per GDP began the century rising several percent per year. The increase even continued into the Depression, countering the fall of GDP per person to maintain the national consumption of pulp unchanged. During the recovery, however, the consumption of pulp per unit of GDP fell, and it has generally fallen since. During the oil shock through the end period, falling pulp use per unit of GDP actually decreased the national pulp consumption slightly.
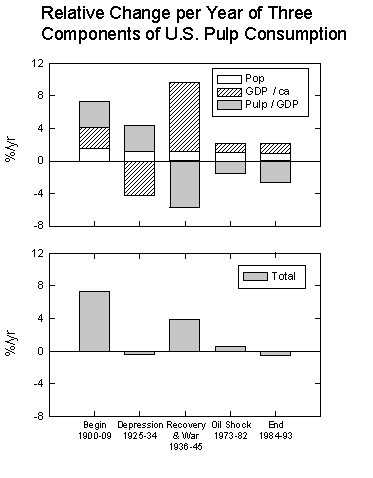
Relative changes in the three components of pulp consumption: population, GDP per person, and pulp IOU (upper panel). The changes of the components are shown by segments of bars for five exemplary ten-year periods. The solid bars in the lower panel show the change in the national consumption produced by the sum of the three components.
Source: Wernick et al., Journal of Industrial Ecology 1(3):125-145, 1997.
Mathematically, what can lower intensity of use (in this case, the ratio of timber products to GDP)? The answer: Anything that raises GDP more than timber use. Armament during the recovery from the depression ballooned production that used relatively little forest product. The war was fought more with bullets than with memos. During the period 1936-45, the divisor GDP rose faster than national consumption of pulp, lowering product per GDP at the same time national consumption went up.
Practically, what changes the amount of forest product used per unit of GDP? In the case of lumber, its replacement during the century by steel and concrete in applications from furniture and barrels to cross ties and lath lowered the intensity of use. Living in the stock of existing houses and prolonging the life of timber products by protecting them from decay and fire also lower it.
In the case of pulp, more widespread literacy and the shift to a service economy raised the intensity of use in the early 20th century. More recently, we might speculate that the onset of dematerialization, as telephones and magnetic files replace letters and manuscripts, is lowering it. Because both writing and packaging consume much pulp, both are opportunities for further improvements in intensity of use.
Overall, history shows that the extent of forests in the United States has changed little in the 20th century, and the volume of wood on American timberland has actually risen by 30% since 1950. While foresters grew more wood per hectare and millers learned to get more product from the same tree, the main reason for the lack of change in forested area is that the average American in 1993 consumed only half the timber for all uses as did a counterpart in 1900.
Overall, environmental trends with respect to materials are equivocal. Moreover, a kilogram of iron does not compare with one of arsenic. But the promise clearly exists to lessen the materials intensity of the economy, to reduce wastes, and to create “wastes” that become nutritious in new industrial food webs. Again, efficiency and substitution are toughening markets.
Conclusion
What then is the challenge for green technologists and managers? Suppose Americans wished to maintain current levels of environmental cleanliness with the 50-percent increase in population likely over the next century and with the current level and kind of economic activity now existing. In this case, emissions per unit of activity would need to drop by one-third. That is an easy target. One-and-a-half percent per year improvement reaches the target in 25 years, well before the population rises by half.
The challenge is much harder taking into account growing consumption. If per capita economic activity doubles roughly every 40 years, as it has since about 1800 in the industrialized countries, the result is a six-fold increase by 2100. Multiplied by population, the United States would have almost 10 times today’s emissions and demands on resources, other things being equal. To maintain or enhance environmental quality, this scenario requires extremely parsimonious use of inputs and micro emissions per unit of economic activity. In other words, Americans need to clean processes by an order of magnitude – to stand still. More reassuringly, the annual rate of cleaning need be only about two percent.
In Europe and Japan population is stable or even shrinking, easing the magnitude of their environmental challenges. The rest of the world, where most people live, faces the twin pressures of enlarging economies and growing populations. So in absolute terms, the performance gains must be enormous.
We have seen the outlines of how the gains can be made. In the long run, we need a smoke-free system of generating hydrogen and electricity that is highly efficient from generator to consumer, as well as food decoupled from acreage, carefully channeled water, and materials smartly designed and selected for their uses and then recycled. In short, we need a lean, dry, light economy.
In truth, I exaggerate the challenge. With respect to consumption, multiplying income will not cause an American to eat twice as much in 2040 or four times more in 2080. Moreover, with respect to production, history shows that the economy can grow from epoch to epoch only by adopting a new industrial paradigm, not by inflating the old. Hay and horses could not power Silicon Valley.
High environmental performance forms an integral part of the modern paradigm of total quality. The past 25 years signal the preferred directions: the changeover from oil to gas, the contraction of crops in favor of land for nature, diffusion of more efficient water use to farmers and residents as well as firms, and the development of a new ecology of materials use in industry.
Economists always worry about trading off benefits in one area for costs in another. Hearteningly, we have seen that, in general, efficiency in energy favors efficiency in materials; efficiency in materials favors efficiency in land; efficiency in land favors efficiency in water; and efficiency in water favors efficiency in energy. The technologies that will thrive, such as information, will concert higher resource productivity.
Some worry that the supply of a fifth major resource, ingenuity, will run short. But nowhere do averages appear near the frontier of current best practice. Simply diffusing what we know can bring gains for several decades. Overall, society hardly glimpses the theoretical limits of performance. More importantly, we forget the power of compounding our gradual technical progress, even at one or two percent per year.
Of course, societies could stop learning. Complex societies have collapsed before. To my eyes, the rejection of science would indicate the greatest danger.
If, however, learning continues as usual, the demand for natural resources will moderate, resource prices will stay low, and pollution will drop – the sustained and collective effect of innumerable actions for technical change and better practices by a multitude of competing firms operating with proper feedback.
Fluctuations, bottlenecks, and falls will make the wayside interesting. Whether they sell autos, carbon, chemicals, corn, electricity, land, paper, or zinc, companies had best take note. Though it will never be easy, the environment for future business will be green.
Bibliography
Ausubel, J.H., 1991, “Energy and Environment: The Light Path,” Energy Systems and Policy 15(3):181-188.
Ausubel, J.H., 1991, “Rat-Race Dynamics and Crazy Companies,” Technological Forecasting and Social Change 39:11-22.
Ausubel, J.H., A. Gruebler, and N. Nakicenovic, 1988, “Carbon Dioxide Emissions in a Methane Economy,” Climatic Change 12(3): 245-263.
Ausubel, J.H. and C. Marchetti, 1996, “Elektron: Electrical Systems in Retrospect and Prospect,” Daedalus 125(3):139-169.
Ayres, R.U., 1989, Energy Inefficiency in the US Economy: A New Case for Conservation, RR-89-12, International Institute for Applied Systems Analysis, Laxenburg, Austria.
Nakicenovic, N., 1996, “Freeing Energy from Carbon,” Daedalus 125(3):95-112.
Wernick, I.K. and J.H. Ausubel, 1995, “National Materials Flows and the Environment,” Annual Review of Energy and the Environment 20:463-492.
Wernick, I.K., P.E. Waggoner, and J.H. Ausubel, 1997, “Searching for Leverage to Conserve Forests: The Industrial Ecology of Wood Products in the U.S.,” Journal of Industrial Ecology 1(3):125-145.
Wernick, I.K., R. Herman, S. Govind, and J.H. Ausubel, 1996, “Materialization and Dematerialization: Measures and Trends,” Daedalus 125(3):171-198.