Area of Research: Cities and Transportation
Lightening the Tread of Population on the Land: American Examples
Cities and Infrastructure: Synthesis and Perspectives
This article, as well as the full publication in which it originally appears, is also available on the National Academies Press website, located at https://www.nap.edu/books/0309037867/html/.
Community Risk Profiles: A Tool to Improve Environment and Community Health
Prepared for the Robert Wood Johnson Foundation
Editor: Iddo K. Wernick, Program for the Human Environment, The Rockefeller University
ISBN 0-9646419-0-9
For more information or to request reprints, please contact us at phe@mail.rockefeller.edu
Preface
This report presents the results of a one-year exploratory study on the “Environment and Community Health: Historical Evolution and Emerging Needs” sponsored by the Robert Wood Johnson Foundation. The Program for the Human Environment at The Rockefeller University conducted the study. The subject of the study was the analytical, informational, and service delivery framework for meeting needs in health care and environmental protection using the community as the focal point or, by medical analogy, the “community as the patient.”
To broaden the base of knowledge and professional contacts available to the project, we formed a Steering Group including members experienced in public health and environment, government, community organization, and information technologies and services (Appendix A). Prior to the first meeting of the Steering Group, we devised a framework to raise relevant issues, better define the most fruitful lines of inquiry, and map out the future course of the project. The Steering Group met on April 19, 1994 at The Rockefeller University. The members resolved to examine three basic questions and commission case studies to explore them in the context of specific communities in the United States.
The three questions were
— What is the current status of deliberative processes for risk assessment at the level of the community?
— How can governments, independent and private sector groups, and researchers better use information technologies to access, integrate, and disseminate information about health and environment and related concerns at the local level?
— What policy levers can government use to ensure that communities better address remediating local environmental hazards and improve the efficacy of local health care delivery?
To conclude the definitional phase of the project, Iddo Wernick drafted a discussion paper with the assistance of the Steering Group articulating the problems so far uncovered and providing the orientation for further work (pages 25-34). Planning for a larger Forum began, and two case studies were formally commissioned to be presented at the Forum. Theodore Glickman, a Senior Fellow at the Center for Risk Management of Resources for the Future (RFF), prepared a report on environmental equity in Allegheny County, Pennsylvania, using a Geographical Information System (GIS) as the framework. Lenny Siegel, Director of the Pacific Studies Center in Mountain View, California, reviewed the recent history of community efforts in addressing environmental problems in Silicon Valley, California, and described a process for developing community risk profiles based on his experience working as a community activist with federal, state, and local governments.
The two case studies, “Evaluating Environmental Equity in Allegheny County” (pages 35-62) and “Comparing Apples and Supercomputers: Evaluating Environmental Risk in Silicon Valley” (pages 63-79) formed the core of the agenda for the Forum on Environment and Community Health, held on September 20, 1994 at The Rockefeller University. The Forum included professionals from the public and private sectors with expertise in public health, environment, and community services (list of participants, Appendix A). Background reading, sent prior to the Forum, oriented participants to the purposes of the project (see Bibliography and Suggested Reading).
This report presents the main findings of the exploratory study. We stop short of costing out its main recommendation, an obvious next step.
Drafted initially by Iddo Wernick, this report synthesizes the informed contributions offered by the many people who have been a part of the study. Reflecting our backgrounds in environment, we tend to offer more detail on environment than health. The Forum participants have reviewed this report, and the Steering Group members have reviewed and approved it.
We thank Doris Manville for her assistance in organizing and administering the project. We wish to thank other people with whom we consulted during the project including Mark Schaefer, Assistant Director for Environment, White House Office of Science and Technology Policy; Margaret Hamburg, M.D., Commissioner, New York City Department of Health; Debora Martin, U.S. Environmental Protection Agency; and Kenneth Jones and colleagues at the Northeast Center for Comparative Risk.
Jesse H. Ausubel
Director, Program for the Human Environment
Iddo K. Wernick
Research Associate, Program for the Human Environment
Cutting the volume of traffic on island
Death and the Human Environment: The United States in the 20th Century
AN INTRODUCTION TO DEADLY COMPETITION
Our subject is the history of death. Researchers have analyzed the time dynamics of numerous populations-nations, companies, products, technologies–competing to fill a niche or provide a given service. Here we review killers, causes of death, as competitors for human bodies. We undertake the analysis to understand better the role of the environment in the evolution of patterns of mortality. Some of the story will prove familiar to public health experts. The story begins in the environment of water, soil, and air, but it leads elsewhere.
Our method is to apply two models developed in ecology to study growth and decline of interacting populations. These models, built around the logistic equation, offer a compact way of organizing numerous data and also enable prediction. The first model represents simple S-shaped growth or decline.[1] The second model represents multiple, overlapping and interacting processes growing or declining in S-shaped paths.[2] Marchetti first suggested the application of logistic models to causes of death in 1982.[3]
The first, simple logistic model assumes that a population grows exponentially until an upper limit inherent in the system is approached, at which point the growth rate slows and the population eventually saturates, producing a characteristic S-shaped curve. A classic example is the rapid climb and then plateau of the number of people infected in an epidemic. Conversely, a population such as the uninfected sleds downward in a similar logistic curve. Three variables characterize the logistic model: the duration of the process (Dt), defined as the time required for the population to grow from 10 percent to 90 percent of its extent; the midpoint of the growth process, which fixes it in time and marks the peak rate of change; and the saturation or limiting size of the population. For each of the causes of death that we examine, we analyze this S-shaped “market penetration” (or withdrawal) and quantify the variables.
Biostatisticians have long recognized competing risks, and so our second model represents multi-species competition. Here causes of death compete with and, if fitter in an inclusively Darwinian sense, substitute for one another. Each cause grows, saturates, and declines, and in the process reduces or creates space for other causes within the overall niche. The growth and decline phases follow the S-shaped paths of the logistic law.
The domain of our analysis is the United States in the 20th century. We start systematically in the year 1900, because that is when reasonably reliable and complete U.S. time series on causes of death begin. Additionally, 1900 is a commencement because the relative importance of causes of death was rapidly and systematically changing. In earlier periods causes of death may have been in rough equilibrium, fluctuating but not systematically changing. In such periods, the logistic model would not apply. The National Center for Health Statistics and its predecessors collect the data analyzed, which are also published in volumes issued by the U.S. Bureau of the Census.[4]
The data present several problems. One is that the categories of causes of death are old, and some are crude. The categories bear some uncertainty. Alternative categories and clusters, such as genetic illnesses, might be defined for which data could be assembled. Areas of incomplete data, such as neonatal mortality, and omissions, such as fetal deaths, could be addressed. To complicate the analysis, some categories have been changed by the U.S. government statisticians since 1900, incorporating, for example, better knowledge of forms of cancer.
Other problems are that the causes of death may be unrecorded or recorded incorrectly. For a decreasing fraction of causes of death, no “modern” cause is assigned. We assume that the unassigned or “other” deaths, which were numerous until about 1930, do not bias the analysis of the remainder. That is, they would roughly pro-rate to the assigned causes. Similarly, we assume no systematic error in early records.
Furthermore, causes are sometimes multiple, though the death certificate requires that ultimately one basic cause be listed.[5] This rule may hide environmental causes. For example, infectious and parasitic diseases thrive in populations suffering drought and malnutrition. The selection rule dictates that only the infectious or parasitic disease be listed as the basic cause. For some communities or populations the bias could be significant, though not, we believe, for our macroscopic look at the 20th century United States.
The analysis treats all Americans as one population. Additional analyses could be carried out for subpopulations of various kinds and by age group.[6] Comparable analyses could be prepared for populations elsewhere in the world at various levels of economic development.[7]
With these cautions, history still emerges.
As a reference point, first observe the top 15 causes of death in America in 1900 (Table 1). These accounted for about 70 percent of the registered deaths. The remainder would include both a sprinkling of many other causes and some deaths that should have been assigned to the leading causes. Although heart disease already is the largest single cause of death in 1900, the infectious diseases dominate the standings.
Death took 1.3 million in the United States in 1900. In 1997 about 2.3 million succumbed. While the population of Americans more than tripled, deaths in America increased only 1.7 times because the death rate halved (Figure 1). As we shall see, early in the century the hunter microbes had better success.
Table 1. U.S. death rate per 100,000 population for leading causes, 1900. For source of data, see Note 4.
| Cause | Rate | Mode of Transmission | |
| 1. | Major Cardiovascular Disease | 345 | [N.A.] |
| 2. | Influenza, Pneumonia | 202 | Inhalation,Intimate Contact |
| 3. | Tuberculosis | 194 | Inhalation,Intimate Contact |
| 4. | Gastritis, Colitus,Enteritis, and Duodenitis | 142 | Contaminated Waterand Food |
| 5. | All Accidents | 72 | [Behavioral] |
| 6. | Malignant Neoplasms | 64 | [N.A.] |
| 7. | Diphtheria | 40 | Inhalation |
| 8. | Typhoid and ParatyphoidFever | 31 | Contaminated Water |
| 9. | Measles | 13 | Inhalation, Intimate Contact |
| 10. | Cirrhosis | 12 | [Behavioral] |
| 11. | Whooping Cough | 12 | Inhalation, Intimate Contact |
| 12. | Syphilis and Its Sequelae | 12 | Sexual Contact |
| 13. | Diabetes Mellitus | 11 | [N.A.] |
| 14. | Suicide | 10 | [Behavioral] |
| 15. | Scarlet Fever and Streptococcal Sore Throat | 9 | Inhalation, Intimate Contact |
DOSSIERS OF EIGHT KILLERS
Let us now review the histories of eight causes of death: typhoid, diphtheria, the gastrointestinal family, tuberculosis, pneumonia plus influenza, cardiovascular, cancer, and AIDS.
For each of these, we will see first how it competes against the sum of all other causes of death. In each figure we show the raw data, that is, the fraction of total deaths attributable to the killer, with a logistic curve fitted to the data. In an inset, we show the identical data in a transform that renders the S-shaped logistic curve linear.[8] It also normalizes the process of growth or decline to one (or to 100 percent). Thus, in the linear transform the fraction of deaths each cause garners, which is plotted on a semi-logarithmic scale, becomes the percent of its own peak level (taken as one hundred percent). The linear transform eases the comparison among cases and the identification of the duration and midpoint of the processes, but also compresses fluctuations.
Typhoid (Figure 2) is a systemic bacterial infection caused primarily by Salmonella typhi.[9] Mary Mallon, the cook (and asymptomatic carrier) popularly known as Typhoid Mary, was a major factor in empowering the New York City Department of Health at the turn of the century. Typhoid was still a significant killer in 1900, though spotty records show it peaked in the 1870s. In the 1890s, Walter Reed, William T. Sedgewick, and others determined the etiology of typhoid fever and confirmed its relation to sewage-polluted water. It took about 40 years to protect against typhoid, with 1914 the year of inflection or peak rate of decline.
Diphtheria (Figure 2) is an acute infectious disease caused by diphtheria toxin of the Corynebacterium diphtheriae. In Massachusetts, where the records extend back further than for the United States as a whole, diphtheria flared to 196 per 100,000 in 1876, or about 10 percent of all deaths. Like typhoid, diphtheria took 40 years to defense, centered in 1911. By the time the diphtheria vaccine was introduced in the early 1930s, 90 percent of its murderous career transition was complete.
Next comes the category of diseases of the gut (Figure 2). Deaths here are mostly attributed to acute dehydrating diarrhea, especially in children, but also to other bacterial infections such as botulism and various kinds of food poisoning. The most notorious culprit was the Vibrio cholerae. In 1833, while essayist Ralph Waldo Emerson was working on his book Nature, expounding the basic benevolence of the universe, a cholera pandemic killed 5 to 15 percent of the population in many American localities where the normal annual death rate from all causes was 2 or 3 percent.
In 1854 in London a physician and health investigator, John Snow, seized the idea of plotting the locations of cholera deaths on a map of the city. Most deaths occurred in St. James Parish, clustered about the Broad Street water pump. Snow discovered that cholera victims who lived outside the Parish also drew water from the pump. Although consumption of the infected water had already peaked, Snow’s famous removal of the pump handle properly fixed in the public mind the means of cholera transmission.[10] In the United States, the collapse of cholera and its relations took about 60 years, centered on 1913. As with typhoid and diphtheria, sanitary engineering and public health measures addressed most of the problem before modern medicine intervened with antibiotics in the 1940s.
In the late 1960s, deaths from gastrointestinal disease again fell sharply. The fall may indicate the widespread adoption of intravenous and oral rehydration therapies and perhaps new antibiotics. It may also reflect a change in record-keeping.
Tuberculosis (Figure 2) refers largely to the infectious disease of the lungs caused by Mycobacterium tuberculosis. In the 1860s and 1870s in Massachusetts, TB peaked at 375 deaths per 100,000, or about 15 percent of all deaths. Henry David Thoreau, author of Walden: or, Life in the Woods, died of bronchitis and tuberculosis at the age of 45 in 1862. TB took about 53 years to jail, centered in 1931. Again, the pharmacopoeia entered the battle rather late. The multi-drug therapies became effective only in the 1950s.
Pneumonia and influenza are combined in Figure 3. They may comprise the least satisfactory category, mixing viral and bacterial aggressors. Figure 3 includes Influenza A, the frequently mutating RNA virus believed to have induced the Great Pandemic of 1918-1919 following World War I, when flu seized about a third of all corpses in the United States. Pneumonia and influenza were on the loose until the 1930s. Then, in 17 years centered on 1940 the lethality of pneumonia and influenza tumbled to a plateau where “flu” has remained irrepressibly for a half century.
Now we shift from pathogens to a couple of other major killers. Major cardiovascular diseases, including heart disease, hypertension, cerebrovascular diseases, atherosclerosis, and associated renal diseases display their triumphal climb and incipient decline in Figure 3. In 1960, about 55 percent of all fatal attacks were against the heart and its allies, culminating a 60-year climb. Having lost 14 points of market share in the past 40 years, cardiovascular disease looks vulnerable. Other paths descend quickly, once they bend downward. We predict an 80-year drop to about 20 percent of American dead. Cardiovascular disease is ripe for treatment through behavioral change and medicine.
A century of unremitting gains for malignant neoplasms appears neatly in Figure 3. According to Ames et al., the culprits are ultimately the DNA-damaging oxidants.[11] One might argue caution in lumping together lung, stomach, breast, prostate, and other cancers. Lung and the other cancers associated with smoking account for much of the rising slope. However, the cancers whose occurrence has remained constant are also winning share if other causes of death diminish. In the 1990s the death rate from malignancies flattened, but the few years do not yet suffice to make a trend. According to the model, cancer’s rise should last 160 years and at peak account for 40 percent of American deaths.
The spoils of AIDS, a meteoric viral entrant, are charted in Figure 3. The span of data for AIDS is short, and the data plotted here may not be reliable. Pneumonia and other causes of death may mask AIDS’ toll. Still, this analysis suggests AIDS reached its peak market of about 2 percent of deaths in the year 1995. Uniquely, the AIDS trajectory suggests medicine sharply blocked a deadly career, stopping it about 60% of the way toward its project fulfillment.
Now look at the eight causes of death as if it were open hunting season for all (Figure 4). Shares of the hunt changed dramatically, and fewer hunters can still shoot to kill with regularity. We can speculate why.
BY WATER, BY AIR
First, consider what we label the aquatic kills: a combination of typhoid and the gastrointestinal family. They cohere visually and phase down by a factor of ten over 33 years centered on 1919 (Figure 5).
Until well into the 19th century, towndwellers drew their water from local ponds, streams, cisterns, and wells.[12] They disposed of the wastewater from cleaning, cooking, and washing by throwing it on the ground, into a gutter, or a cesspool lined with broken stones. Human wastes went to privy vaults, shallow holes lined with brick or stone, close to home, sometimes in the cellar. In 1829 residents of New York City deposited about 100 tons of excrement each day in the city soil. Scavengers collected the “night soil” in carts and dumped it nearby, often in streams and rivers.
Between 1850 and 1900 the share of the American population living in towns grew from about 15 to about 40 percent. The number of cities over 50,000 grew from 10 to more than 50. Increasing urban density made waste collection systems less adequate. Overflowing privies and cesspools filled alleys and yards with stagnant water and fecal wastes. The growing availability of piped-in water created further stress. More water was needed for fighting fires, for new industries that required pure and constant water supply, and for flushing streets. To the extent they existed, underground sewers were designed more for storm water than wastes. One could not design a more supportive environment for typhoid, cholera, and other water-borne killers.
By 1900 towns were building systems to treat their water and sewage. Financing and constructing the needed infrastructure took several decades. By 1940 the combination of water filtration, chlorination, and sewage treatment stopped most of the aquatic killers.
Refrigeration in homes, shops, trucks, and railroad boxcars took care of much of the rest. The chlorofluorocarbons (CFCs) condemned today for thinning the ozone layer were introduced in the early 1930s as a safer and more effective substitute for ammonia in refrigerators. The ammonia devices tended to explode. If thousands of Americans still died of gastrointestinal diseases or were blown away by ammonia, we might hesitate to ban CFCs.
Let us move now from the water to the air (Figure 6). “Aerial” groups all deaths from influenza and pneumonia, TB, diphtheria, measles, whooping cough, and scarlet fever and other streptococcal diseases. Broadly speaking these travel by air. To a considerable extent they are diseases of crowding and unfavorable living and working conditions.
Collectively, the aerial diseases were about three times as deadly to Americans as their aquatic brethren in 1900. Their breakdown began more than a decade later and required almost 40 years.
The decline could be decomposed into several sources. Certainly large credit goes to improvements in the built environment: replacement of tenements and sweatshops with more spacious and better ventilated homes and workplaces. Huddled masses breathed free. Much credit goes to electricity and cleaner energy systems at the level of the end user.
Reduced exposure to infection may be an unrecognized benefit of shifting from mass transit to personal vehicles. Credit obviously is also due to nutrition, public health measures, and medical treatments.
The aerial killers have kept their market share stable since the mid-1950s. Their persistence associates with poverty; crowded environments such as schoolrooms and prisons; and the intractability of viral diseases. Mass defense is more difficult. Even the poorest Bostonians or Angelenos receive safe drinking water; for the air, there is no equivalent to chlorination.
Many aerial attacks occurred in winter, when indoor crowding is greatest. Many aquatic kills were during summer, when the organic fermenters were speediest. Diarrhea was called the summer complaint. In Chicago between 1867 and 1925 a phase shift occurred in the peak incidence of mortality from the summer to the winter months.[13] In America and other temperate zone industrialized countries, the annual mortality curve has flattened during this century as the human environment has come under control. In these countries, most of the faces of death are no longer seasonal.
BY WAR, BY CHANCE?
Let us address briefly the question of where war and accidents fit. In our context we care about war because disputed control of natural resources such as oil and water can cause war. Furthermore, war leaves a legacy of degraded environment and poverty where pathogens find prey. We saw the extraordinary spike of the flu pandemic of 1918-1919.
War functions as a short-lived and sometimes intense epidemic. In this century, the most intense war in the developed countries may have been in France between 1914-1918, when about one-quarter of all deaths were associated with arms.[14] The peak of 20th century war deaths in the United States occurred between 1941-1945 when about 7 percent of all deaths were in military service, slightly exceeding pneumonia and influenza in those years.
Accidents, which include traffic, falls, drowning, and fire follow a dual logic. Observe the shares of auto and all other accidents in the total kills in the United States during this century (Figure 7). Like most diseases, fatal non-auto accidents have dropped, in this case rather linearly from about 6 percent to about 2 percent of all fatalities. Smiths and miners faced more dangers than office workers. The fall also reflects lessening loss of life from environmental hazards such as floods, storms, and heat waves.
Auto accidents do not appear accidental at all but under perfect social control. On the roads, we appear to tolerate a certain range of risk and regulate accordingly, an example of so-called risk homeostasis.[15] The share of killing by auto has fluctuated around 2 percent since about 1930, carefully maintained by numerous changes in vehicles, traffic management, driving habits, driver education, and penalties.
DEADLY ORDER
Let us return to the main story. Infectious diseases scourged the 19th century. In Massachusetts in 1872, one of the worst plague years, five infectious diseases, tuberculosis, diphtheria, typhoid, measles, and smallpox, alone accounted for 27 percent of all deaths. Infectious diseases thrived in the environment of the industrial revolution’s new towns and cities, which grew without modern sanitation.
Infectious diseases, of course, are not peculiarly diseases of industrialization. In England during the intermittent plagues between 1348-1374 half or more of all mortality may have been attributable to the Black Death.[16] The invasion of smallpox into Central Mexico at the time of the Spanish conquest depopulated central Mexico.[17] Gonorrhea depopulated the Pacific island of Yap.[18]
At the time of its founding in 1901, our institution, the Rockefeller Institute for Medical Research as it was then called, appropriately focused on the infectious diseases. Prosperity, improvements in environmental quality, and science diminished the fatal power of the infectious diseases by an order of magnitude in the United States in the first three to four decades of this century. Modern medicine has kept the lid on.[19]
If infections were the killers of reckless 19th century urbanization, cardiovascular diseases were the killers of 20th century modernization. While avoiding the subway in your auto may have reduced the chance of influenza, it increased the risk of heart disease. Traditionally populations fatten when they change to a “modern” lifestyle. When Samoans migrate to Hawaii and San Francisco or live a relatively affluent life in American Samoa, they gain between 10 and 30 kg.[20]
The environment of cardiovascular death is not the Broad Street pump but offices, restaurants, and cars. So, heart disease and stroke appropriately roared to the lead in the 1920s.
Since the 1950s, however, cardiovascular disease has steadily lost ground to a more indefatigable terminator, cancer. In our calculation, cancer passed infection for the #2 spot in 1945. Americans appear to have felt the change. In that year Alfred P. Sloan and Charles Kettering channeled some of the fortune they had amassed in building the General Motors Corporation to found the Sloan-Kettering Cancer Research Center.
Though cancer trailed cardiovascular in 1997 by 41 to 23 percent, cancer should take over as the nation’s #1 killer by 2015, if long-run dynamics continue as usual (Figure 8). The main reasons are not environmental. Doll and Peto estimate that only about 5 percent of U.S. cancer deaths are attributable to environmental pollution and geophysical factors such as background radiation and sunlight.[21]
The major proximate causes of current forms of cancer, particularly tobacco smoke and dietary imbalances, can be reduced. But if Ames and others are right that cancer is a degenerative disease of aging, no miracle drugs should be expected, and one form of cancer will succeed another, assuring it a long stay at the top of the most wanted list. In the competition among the three major families of death, cardiovascular will have held first place for almost 100 years, from 1920 to 2015.
Will a new competitor enter the hunt? As various voices have warned, the most likely suspect is an old one, infectious disease.[22] Growth of antibiotic resistance may signal re-emergence. Also, humanity may be creating new environments, for example, in hospitals, where infection will again flourish. Massive population fluxes over great distances test immune systems with new exposures. Human immune systems may themselves weaken, as children grow in sterile apartments rather than barnyards.[23] Probably most important, a very large number of elderly offer weak defense against infections, as age-adjusted studies could confirm and quantify. So, we tentatively but logically and consistently project a second wave of infectious disease. In Figure 9 we aggregate all major infectious killers, both bacterial and viral. The category thus includes not only the aquatics and aerials discussed earlier, but also septicemia, syphilis, and AIDS.[24] A grand and orderly succession emerges.
SUMMARY
Historical examination of causes of death shows that lethality may evolve in consistent and predictable ways as the human environment comes under control. In the United States during the 20th century infections became less deadly, while heart disease grew dominant, followed by cancer. Logistic models of growth and multi-species competition in which the causes of death are the competitors describe precisely the evolutionary success of the killers, as seen in the dossiers of typhoid, diphtheria, the gastrointestinal family, pneumonia/influenza, cardiovascular disease, and cancer. Improvements in water supply and other aspects of the environment provided the cardinal defenses against infection. Environmental strategies appear less powerful for deferring the likely future causes of death. Cancer will overtake heart disease as the leading U.S. killer around the year 2015 and infections will gradually regain their fatal edge. If the orderly history of death continues.
FIGURES
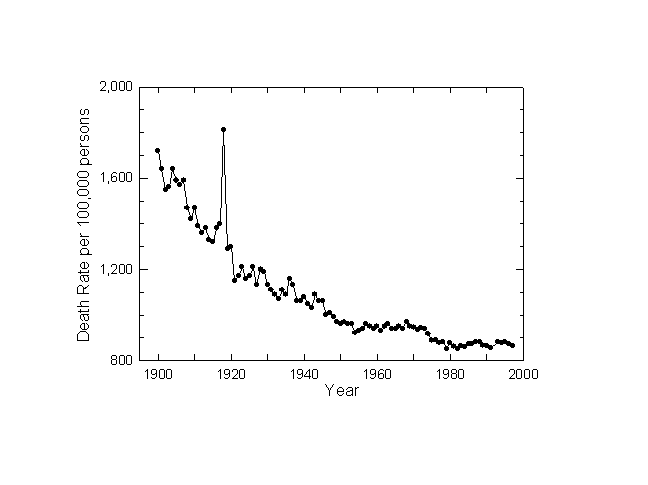
Figure 1. Crude Death Rate: U.S. 1900-1997. Sources of data: Note 4.
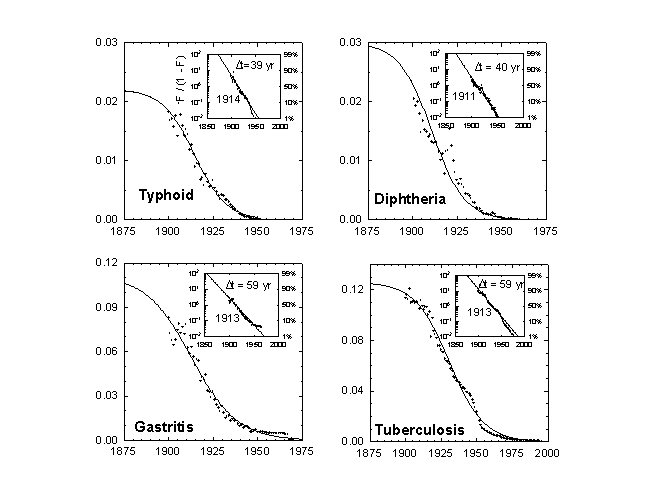
Figure 2a. Typhoid and Paratyphoid Fever as a Fraction of All Deaths: U.S. 1900-1952. The larger panel shows the raw data and a logistic curve fitted to the data. The inset panel shows the same data and a transform that renders the S-shaped curve linear and normalizes the process to 1. “F” refers to the fraction of the process completed. Here the time it takes the process to go from 10 percent to 90 percent of its extent is 39 years, and the midpoint is the year 1914. Source of data: Note 4.
Figure 2b. Diphtheria as a Fraction of All Deaths: U.S. 1900-1956. Source of data: Note 4.
Figure 2c. Gastritis, Duodenitis, Enteritis, and Colitis as a Fraction of All Deaths: U.S. 1900-1970. Source of data: Note 4.
Figure 2d. Tuberculosis, All Forms, as a Fraction of All Deaths: U.S. 1900-1997. Sources of data: Note 4.
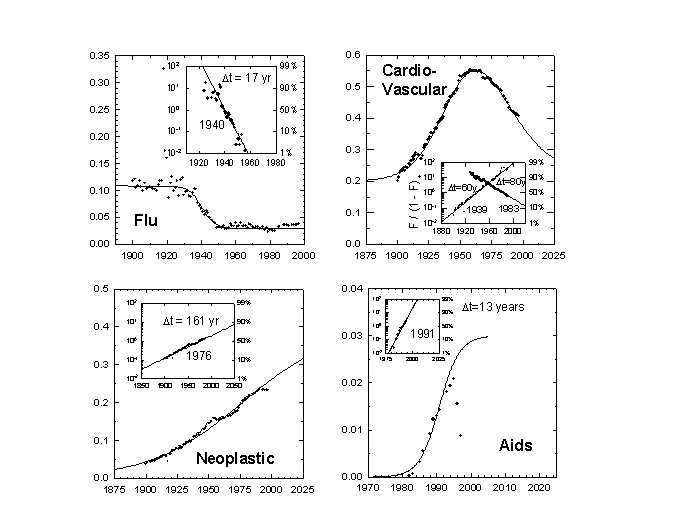
Figure 3a. Pneumonia and Influenza as a Fraction of All Deaths: U.S. 1900-1997. Note the extraordinary pandemic of 1918-1919. Sources of data: Note 4.
Figure 3b. Major Cardiovascular Diseases as a Fraction of All Deaths: U.S. 1900-1997. In the inset, the curve is decomposed into upward and downward logistics which sum to the actual data values. The midpoint of the 60-year rise of cardiovascular disease was the year 1939, while the year 1983 marked the midpoint of its 80-year decline. Sources of data: Note 4.
Figure 3c. Malignant Neoplasms as a Fraction of All Deaths: U.S. 1900-1997. Sources of data: Note 4.
Figure 3d. AIDS as a Fraction of All Deaths: U.S. 1981-1997. Sources of data: Note 4.
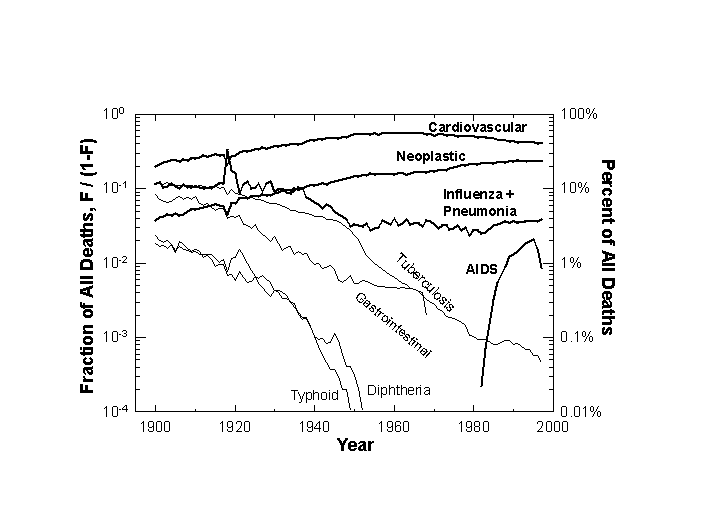
Figure 4. Comparative Trajectories of Eight Killers: U.S. 1900-1997. The scale is logarithmic, with fraction of all deaths shown on the left scale with the equivalent percentages marked on the right scale. Sources of data: Note 4.
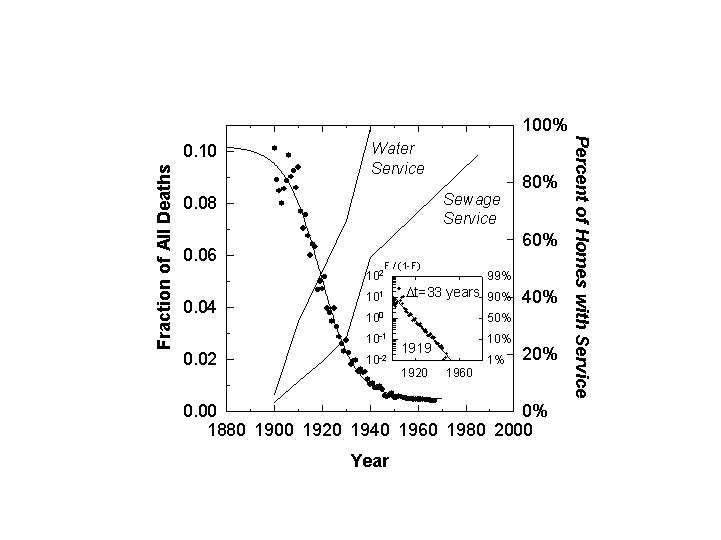
Figure 5. Deaths from Aquatically Transmitted Diseases as a Fraction of All Deaths: U.S. 1900-1967. Superimposed is the percentage of homes with water and sewage service (right scale). Source of data: Note 4.
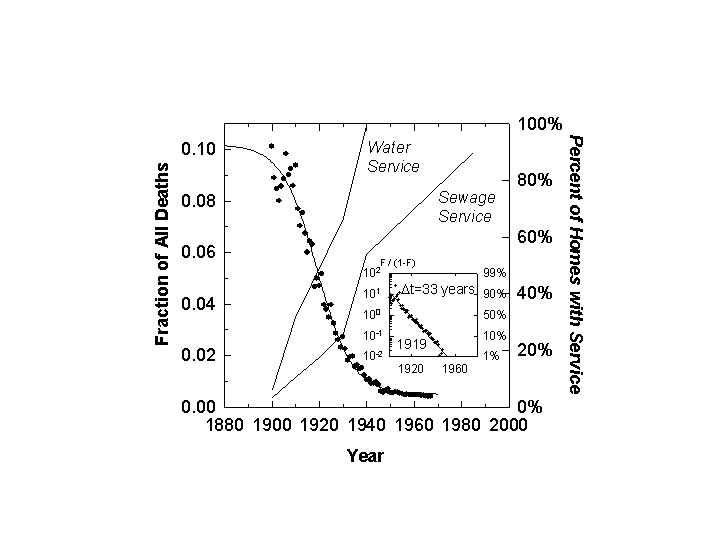
Figure 6. Deaths from Aerially Transmitted Diseases as a Fraction of All Deaths: U.S. 1900-1997. Sources of data: Note 4.
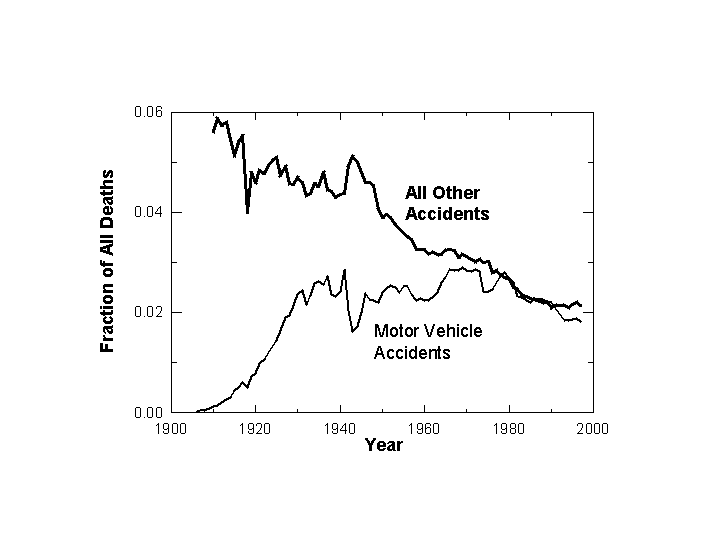
Figure 7. Motor Vehicle and All Other Accidents as a Fraction of All Deaths: U.S. 1900-1997. Sources of data: Note 4.
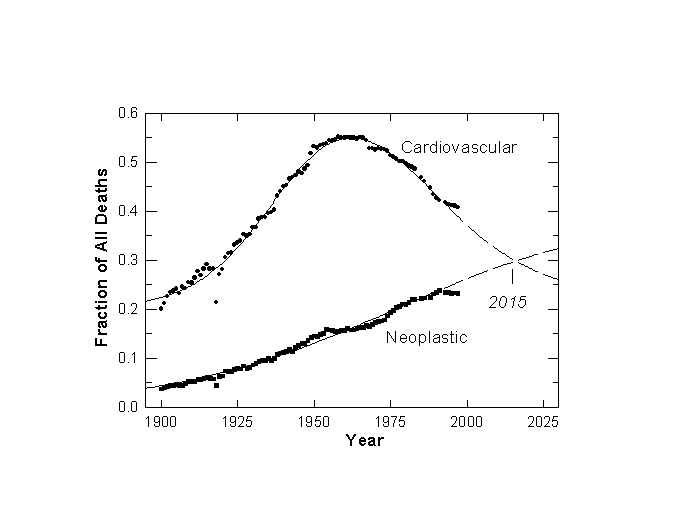
Figure 8. Major Cardiovascular Diseases and Malignant Neoplasms as a Fraction of All U.S. Deaths: 1900-1997. The logistic model predicts (dashed lines) Neoplastic will overtake Cardiovascular as the number one killer in 2015. Sources of data: Note 4.
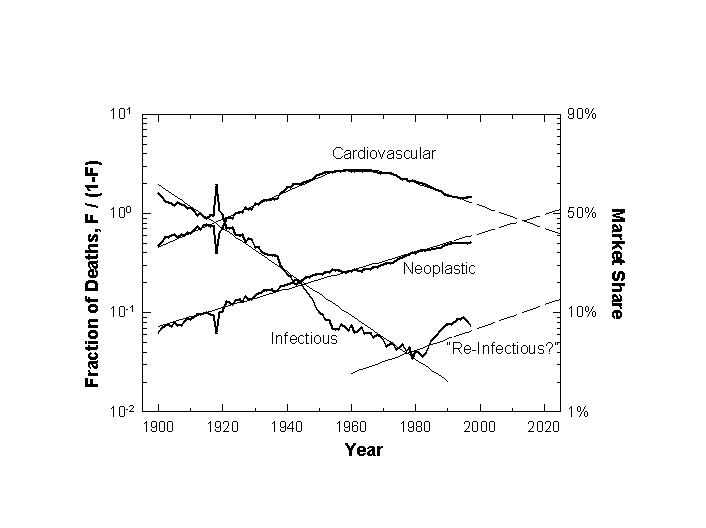
Figure 9. Major Causes of Death Analyzed with a Multi-species Model of Logistic Competition. The fractional shares are plotted on a logarithmic scale which makes linear the S-shaped rise and fall of market shares.
Notes
[1] On the basic model see: Kingsland SE. Modeling Nature: Episodes in the History of Population Ecology. Chicago: University of Chicago Press, 1985. Meyer PS. Bi-logistic growth. Technological Forecasting and Social Change 1994;47:89-102.
[2] On the model of multi-species competition see Meyer PS, Yung JW, Ausubel JH. A Primer on logistic growth and substitution: the mathematics of the Loglet Lab software. Technological Forecasting and Social Change 1999;61(3):247-271.
[3] Marchetti C. Killer stories: a system exploration in mortal disease. PP-82-007. Laxenburg, Austria: International Institute for Applied Systems Analysis, 1982. For a general review of applications see: Nakicenovic N, Gruebler A, eds. Diffusion of Technologies and Social Behavior. New York: Springer-Verlag, 1991.
[4] U.S. Bureau of the Census, Historical Statistics of the United States: Colonial Times to 1970, Bicentennial Editions, Parts 1 & 2. Washington DC: U.S. Bureau of the Census: 1975. U.S. Bureau of the Census, Statistical Abstract of the United States: 1999 (119th edition). Washington DC: 1999, and earlier editions in this annual series.
[5] Deaths worldwide are assigned a “basic cause” through the use of the “Rules for the Selection of Basic Cause” stated in the Ninth Revision of the International Classification of Diseases. Geneva: World Health Organization. These selection rules are applied when more than one cause of death appears on the death certificate, a fairly common occurrence. From an environmental perspective, the rules are significantly biased toward a medical view. In analyzing causes of death in developing countries and poor communities, the rules can be particularly. For general discussion of such matters see Kastenbaum R, Kastenbaum B. Encyclopedia of Death. New York: Avon, 1993.
[6] For discussion of the relation of causes of death to the age structure of populations see Hutchinson GE. An Introduction to Population Ecology. New Haven: Yale University Press, 1978, 41-89. See also Zopf PE Jr. Mortality Patterns and Trends in the United States. Westport CT: Greenwood, 1992.
[7] Bozzo SR, Robinson CV, Hamilton LD. The use of a mortality-ratio matrix as a health index.” BNL Report No. 30747. Upton NY: Brookhaven National Laboratory, 1981.
[8] For explanation of the linear transform, see Fisher JC, Pry RH. A simple substitution model of technological change. Technological Forecasting and Social Change 1971;3:75-88.
[9] For reviews of all the bacterial infections discussed in this paper see: Evans AS, Brachman PS, eds., Bacterial Infections of Humans: Epidemiology and Control. New York: Plenum, ed. 2, 1991. For discussion of viral as well as bacterial threats see: Lederberg J, Shope RE, Oaks SC Jr., eds., Emerging Infections: Microbial Threats to Health in the United States. Washington DC: National Academy Press, 1992. See also Kenneth F. Kiple, ed., The Cambridge World History of Disease. Cambridge UK: Cambridge Univ. Press, 1993.
[10] For precise exposition of Snow’s role, see Tufte ER. Visual Explanations: Images and Quantities, Evidence and Narrative. Cheshire CT: Graphics Press, 1997:27-37.
[11] Ames BN, Gold LS. Chemical Carcinogens: Too Many Rodent Carcinogens. Proceedings of the National Academy of Sciences of the U.S.A. 1987;87:7772-7776.
[12] Tarr JA. The Search for the Ultimate Sink: Urban Pollution in Historical Perspective. Akron OH: University of Akron Press, 1996.
[13] Weihe WH. Climate, health and disease. Proceedings of the World Climate Conference. Geneva: World Meteorological Organization, 1979.
[14] Mitchell BR. European Historical Statistics 1750-1975. New York: Facts on File, 1980:ed. 2.
[15] Adams JGU., Risk homeostasis and the purpose of safety regulation. Ergonomics 1988;31:407-428.
[16] Russell JC. British Medieval Population. Albuquerque NM: Univ. of New Mexico, 1948.
[17] del Castillo BD. The Discovery and Conquest of Mexico, 1517-1521. New York: Grove, 1956.
[18] Hunt EE Jr. In Health and the Human Condition: Perspectives on Medical Anthropology. Logan MH, Hunt EE,eds. North Scituate, MA: Duxbury, 1978.
[19] For perspectives on the relative roles of public health and medical measures see Dubos R. Mirage of Health: Utopias, Progress, and Biological Change. New York: Harper, 1959. McKeown T, Record RG, Turner RD. An interpretation of the decline of mortality in England and Wales during the twentieth century,” Population Studies 1975;29:391-422. McKinlay JB, McKinlay SM. The questionable contribution of medical measures to the decline of mortality in the United States in the twentieth century.” Milbank Quarterly on Health and Society Summer 1977:405-428.¥r¥r
[20] Pawson IG, Janes, C. Massive obesity in a migrant Samoan population. American Journal of Public Health 1981;71:508-513.
[21] Doll R, Peto R. The Causes of Cancer. New York: Oxford University Press, 1981.
[22] Lederberg J, Shope RE, Oaks SC Jr., eds. Emerging Infections: Microbial Threats to Health in the United States. Washington DC: National Academy, 1992. Ewald PW. Evolution of Infectious Disease. New York: Oxford, 1994.
[23] Holgate ST, The epidemics of allergy and asthma. Nature 1999;402supp:B2-B4.
[24] The most significant present (1997) causes of death subsumed under “all causes” and not represented separately in Figure 9 are chronic obstructive pulmonary diseases (4.7%), accidents (3.9%), diabetes mellitus (2.6%), suicide (1.3%), chronic liver disease and cirrhosis (1.0%), and homicide (0.8%). The dynamic in the figure remains the same when these causes are included in the analysis. In our logic, airborne and other allergens, which cause some of the pulmonary deaths, might also be grouped with infections, although the invading agents are not bacteria or viruses.
Maglevs and the Vision of St. Hubert
1. Introduction
The emblems of my essay are maglevs speeding through tunnels below the earth and a crucifix glowing between the antlers of a stag, the vision of St. Hubert. Propelled by magnets, maglev trains levitate passengers with green mobility. Maglevs symbolize technology, while the fellowship of St. Hubert with other animals symbolizes behavior.
Better technology and behavior can do much to spare and restore Nature during the 21st century, even as more numerous humans prosper.
In this essay I explore the areas in human use for fishing, farming, logging, and cities. Offsetting the sprawl of cities, rising yields in farms and forests and changing tastes can spare wide expanses of land. Shifting from hunting seas to farming fish can similarly spare Nature. I will conclude that cardinal resolutions to census marine life, lift crop yields, increase forest area, and tunnel for maglevs would firmly promote the Great Restoration of Nature on land and in the sea. First, let me share the vision of St. Hubert.
2. The Vision of St. Hubert
In The Hague, about the year 1650, a 25 year-old Dutch artist, Paulus Potter, painted a multi-paneled picture that graphically expresses contemporary emotions about the environment.[i] Potter named his picture “The Life of the Hunter” (Figure 1). The upper left panel establishes the message of the picture with reference to the legend of the vision of St. Hubert.[ii] Around the year 700, Hubert, a Frankish courtier, hunted deep in the Ardennes forest on Good Friday, a Christian spring holy day. A stag appeared before Hubert with a crucifix glowing between its antlers, and a heavenly voice reproached him for hunting, particularly on Good Friday. Hubert’s aim faltered, and he renounced his bow and arrow. He also renounced his riches and military honors, and became a priest in Maastricht.
The upper middle panel, in contrast, shows a hunter with two hounds. Seven panels on the sides and bottom show the hunter and his servant hounds targeting other animals: rabbit, wolf, bull, lion, wild boar, bear, and mountain goat. The hunter’s technologies include sword, bow, and guns .
One panel on either side recognizes consciousness, in fact, self-consciousness, in our fellow animals. In the middle on the right, a leopard marvels at its reflection in a mirror. On the lower left apes play with their self-images in a shiny plate.
In the large central panels Potter judges 17th century hunters. First, in the upper panel the man and his hounds come before a court of the animals they have hunted. In the lower central, final panel the animal jury celebrates uproariously, while the wolf, rabbit, and monkey cooperate to hang the hunter’s dogs as an elephant, goat, and bear roast the hunter himself. Paulus Potter believed the stag’s glowing cross converted St. Hubert to sustainability. The hunter remained unreconstructed.
With Paulus and Hubert, we can agree on the vision of a planet teeming with life, a Great Restoration of Nature. And most would agree we need ways to accommodate the billions more humans likely to arrive while simultaneously lifting humanity’s standard of living. In the end, two means exist to achieve the Great Restoration. St. Hubert exemplifies one, behavioral change. The hunter’s primitive weapons hint at the second, technology. What can we expect from each? First, some words about behavior.
3. Our Triune Brain
In a fundamental 1990 book, The Triune Brain in Evolution, neuroscientist Paul MacLean explained that humans have three brains, each developed during a stage of evolution.[iii] The earliest, found in snakes, MacLean calls the reptilian brain (Figure 2). In mammals another brain appeared, the paleomammalian, bringing such new behavior as care of the young and mutual grooming. In humans came the most recent evolutionary structure, the hugely expanded neocortex. This neomammalian brain brought language, visualization, and symbolic skills. But conservative evolution did not replace the reptilian brain, it added. Thus, we share primal behavior with other animals, including snakes. The reptilian brain controls courting mates, patrolling territory, dominating submissives, and flocking together. The reptilian brain makes most of the sensational news and will not retreat. Our brains and thus our basic instincts and behaviors have remained largely unchanged for a million years or more. They will not change on time scales considered for “sustainable development.”
Of course, innovations may occur that control individual and social behavior. Law and religion both try, though the snake brain keeps reasserting itself, on Wall Street, in the Balkans, and clawing for Nobel prizes in Stockholm.
Pharmacology also tries for behavioral control, with increasing success. Having penetrated only perhaps 10% of their global market, sales of new “anti-depressants,” mostly tinkering with serotonin in the brain, neared $10 billion in 2000. Drugs can surely make humans very happy, but without restoring Nature.
Because, I believe, behavioral sanctions will be hard-pressed to control the eight or ten billion snake brains persisting in humanity, we should use our hugely expanded neocortex on technology that allows us to tread lightly on Earth. Since ever, homo faber has been trying to make things better and to make better things. During the past two centuries we have become more systematic and aggressive about it, through the diffusion of research & development and the institutions that perform them, including corporations and universities.
What can behavior and technology do to spare and restore Nature during the 21st century? Let’s consider the seas and then the land.
4. Sparing sea life
St. Hubert exemplifies behavior to spare land’s animals. Many thousands of years ago our ancestors sharpened sticks and began hunting. They probably extinguished a few species, such as woolly mammoths, and had they kept on hunting, they might have extinguished many more. Then without waiting on St Hubert, our ancestors ten thousand years ago began sparing land animals in Nature by domesticating cows, pigs, goats, and sheep. By herding rather than hunting animals, humans began a technology to spare wild animals — on land.
In 2001 about 90 million tons of fish are being taken wild from the sea and 30 from fish farms and ranches. Sadly, little reliable information quantifies the diversity, distribution, and abundance of life in the sea, but many anecdotes suggest large, degrading changes. In any case, the ancient sparing of land animals by farming shows us an effective way to spare the fish in the sea. We need to raise the share we farm and lower the share we catch. Other human activities, such as urbanization of coastlines and tampering with the climate, disturb the seas, but today fishing matters most. Compare an ocean before and after heavy fishing.
Fish farming does not require invention. It has been around for a long time. For centuries, the Chinese have been doing very nicely raising herbivores, such as carp.
Following the Chinese example, one feeds crops grown on land by farmers to herbivorous fish in ponds. Much aquaculture of carp and tilapia in Southeast Asia and the Philippines and of catfish near the Gulf Coast of the USA takes this form. The fish grown in the ponds spare fish from the ocean. Like poultry, fish efficiently convert protein in feed to protein in meat. And because the fish do not have to stand, they convert calories in feed into meat even more efficiently than poultry. All the improvements such as breeding and disease control that have made poultry production more efficient can be and have been applied to aquaculture, improving the conversion of feed to meat and sparing wild fish.[iv] With due care for effluents and pathogens, this model can multiply many times in tonnage.
A riskier and fascinating alternative, ocean farming, would actually lift life in the oceans.[v] The oceans vary vastly in their present productivity. In parts of the ocean crystal clear water enables a person to see 50 meters down. These are deserts. In a few garden areas, where one can see only a meter or so, life abounds. Water rich in iron, phosphorus, trace metals, silica, and nitrate makes these gardens dense with plants and animals. The experiments for marine sequestration of carbon demonstrate the extraordinary leverage of iron to make the oceans bloom.
Adding the right nutrients in the right places might lift fish yields by a factor of hundreds. Challenges abound because the ocean moves and mixes, both vertically and horizontally. Nevertheless, technically and economically promising proposals exist for farming on a large scale in the open ocean with fertilization in deep water. One kg of buoyant fertilizer, mainly iron with some phosphate, could produce a few thousand tons of biomass.[vi]
Improving the fishes’ pasture of marine plants is the crucial first step to greater productivity. Zooplankton then graze on phytoplankton, and the food chain continues until the sea teems with diverse life. Fertilizing 250,000 sq km of barren tropical ocean, the size of the USA state of Colorado, in principle might produce a catch matching today’s fish market of 100 million tons. Colorado spreads less than 1/10th of 1% as wide as the world ocean.
The point is that the today’s depleting harvest of wild fishes and destruction of marine habitat to capture them need not continue. The 25% of seafood already raised by aquaculture signals the potential for Restoration (Figure 3). Following the example of farmers who spare land and wildlife by raising yields on land, we can concentrate our fishing in highly productive, closed systems on land and in a few highly productive ocean farms. Humanity can act to restore the seas, and thus also preserve traditional fishing where communities value it. With smart aquaculture, we can multiply life in the oceans while feeding humanity and restoring Nature. St. Hubert, of course, might improve the marine prospect by not eating fellow creatures from the sea.
5. Sparing farmland
What about sparing nature on land? How much must our farming, logging, and cities take?
First, can we spare land for nature while producing our food? [vii] Yields per hectare measure the productivity of land and the efficiency of land use. For centuries land cropped expanded faster than population, and cropland per person rose as people sought more proteins and calories. Fifty years ago farmers stopped plowing up nature (Figure 4). During the past half-century, ratios of crops to land for the world’s major grains-corn, rice, soybean, and wheat-have climbed fast on all six of the farm continents. Between 1972-1995 Chinese cereal yields rose 3.3% per year per hectare. Per hectare, the global Food Index of the Food and Agriculture Organization of the UN, which reflects both quantity and quality of food, has risen 2.3% annually since 1960. In the USA in 1900 the protein or calories raised on one Iowa hectare fed four people for the year. In 2000 a hectare on the Iowa farm of master grower Mr. Francis Childs could feed eighty people for the year.
Since the middle of the 20th century, such productivity gains have stabilized global cropland, and allowed reductions of cropland in many nations, including China. Meanwhile, growth in the world’s food supply has continued to outpace population, including in poor countries. A cluster of innovations including tractors, seeds, chemicals, and irrigation, joined through timely information flows and better organized markets, raised the yields to feed billions more without clearing new fields. We have decoupled food from acreage.
High-yield agriculture need not tarnish the land. Precision agriculture is the key. This approach to farming relies on technology and information to help the grower prescribe and deliver precise inputs of fertilizer, pesticides, seed, and water exactly where they are needed. We had two revolutions in agriculture in the 20th century. First, the tractors of mechanical engineers saved the oats that horses ate and multiplied the power of labor. Then chemical engineers and plant breeders made more productive plants. The present agricultural revolution comes from information engineers. What do the past and future agricultural revolutions mean for land?
To produce their present crop of wheat, Indian farmers would need to farm more than three times as much land today as they actually do, if their yields had remained at their 1966 level. Let me offer a second comparison: a USA city of 500,000 people in 2000 and a USA city of 500,000 people with the 2000 diet but the yields of 1920. Farming as Americans did 80 years ago while eating as Americans do now would require 4 times as much land for the city, about 450,000 hectares instead of 110,000.
What can we look forward to globally? The agricultural production frontier remains spacious. On the same area, the average world farmer grows only about 20 percent of the corn of the top Iowa farmer, and the average Iowa farmer lags more than 30 years behind the state-of-the-art of his most productive neighbor. On average the world corn farmer has been making the greatest annual percentage improvement. If during the next 60 to 70 years, the world farmer reaches the average yield of today’s USA corn grower, the ten billion people then likely to live on Earth will need only half of today’s cropland. This will happen if farmers maintain on average the yearly 2% worldwide growth per hectare of the Food Index achieved since 1960, in other words, if dynamics, social learning, continues as usual. Even if the rate falls to 1%, an area the size of India, globally, could revert from agriculture to woodland or other uses. Averaging an improvement of 2% per year in the productivity and efficiency of natural resource use may be a useful operational definition of sustainability.
Importantly, as Hubert would note, a vegetarian diet of 3,000 primary calories per day halves the difficulty or doubles the land spared. Hubert might also observe that eating from a salad bar is like taking a sport utility vehicle to a gasoline filling station. Living on crisp lettuce, which offers almost no protein or calories, demands many times the energy of a simple rice-and-beans vegan diet.[viii] Hubert would wonder at the greenhouses of the Benelux countries glowing year round day and night. I will trust more in the technical advance of farmers than in behavioral change by eaters. The snake brain is usually a gourmet and a gourmand.
Fortunately, lifting yields while minimizing environmental fall out, farmers can effect the Great Restoration.
6. Sparing forests
Farmers may no longer pose much threat to nature. What about lumberjacks? As with food, the area of land needed for wood is a multiple of yield and diet, or the intensity of use of wood products in the economy, as well as population and income. Let’s focus on industrial wood — logs cut for lumber, plywood, and pulp for paper.
The wood “diet” required to nourish an economy is determined by the tastes and actions of consumers and by the efficiency with which millers transform virgin wood into useful products.[ix] Changing tastes and technological advances are already lightening pressure on forests. Concrete, steel, and plastics have replaced much of the wood once used in railroad ties, house walls, and flooring. Demand for lumber has become sluggish, and in the last decade world consumption of boards and plywood actually declined. Even the appetite for pulpwood, logs that end as sheets of paper and board, has leveled.
Meanwhile, more efficient lumber and paper milling is already carving more value from the trees we cut.[x] And recycling has helped close leaks in the paper cycle. In 1970, consumers recycled less than one-fifth of their paper; today, the world average is double that.
The wood products industry has learned to increase its revenue while moderating its consumption of trees. Demand for industrial wood, now about 1.5 billion cubic meters per year, has risen only 1% annually since 1960 while the world economy has multiplied at nearly four times that rate. If millers improve their efficiency, manufacturers deliver higher value through the better engineering of wood products, and consumers recycle and replace more, in 2050 virgin demand could be only about 2 billion cubic meters and thus permit reduction in the area of forests cut for lumber and paper.
The permit, as with agriculture, comes from lifting yield. The cubic meters of wood grown per hectare of forest each year provide strong leverage for change. Historically, forestry has been a classic primary industry, as Hubert doubtless saw in the shrinking Ardennes. Like fishers and hunters, foresters have exhausted local resources and then moved on, returning only if trees regenerated on their own. Most of the world’s forests still deliver wood this way, with an average annual yield of perhaps two cubic meters of wood per hectare. If yield remains at that rate, by 2050 lumberjacks will regularly saw nearly half the world’s forests (Figure 5). That is a dismal vision — a chainsaw every other hectare, skinhead Earth.
Lifting yields, however, will spare more forests. Raising average yields 2 percent per year would lift growth over 5 cubic meters per hectare by 2050 and shrink production forests to just about 12 percent of all woodlands. Once again, high yields can afford a Great Restoration.
At likely planting rates, at least one billion cubic meters of wood — half the world’s supply — could come from plantations by the year 2050. Semi-natural forests — for example, those that regenerate naturally but are thinned for higher yield — could supply most of the rest. Small-scale traditional “community forestry” could also deliver a small fraction of industrial wood. Such arrangements, in which forest dwellers, often indigenous peoples, earn revenue from commercial timber, can provide essential protection to woodlands and their inhabitants.
More than a fifth of the world’s virgin wood is already produced from forests with yields above 7 m3 per hectare. Plantations in Brazil, Chile, and New Zealand can sustain yearly growth of more than 20 m3 meters per hectare with pine trees. In Brazil eucalyptus — a hardwood good for some papers — delivers more than 40 m3 per hectare. In the Pacific Northwest and British Columbia, with plentiful rainfall, hybrid poplars deliver 50 m3 per hectare.
Environmentalists worry that industrial plantations will deplete nutrients and water in the soil and produce a vulnerable monoculture of trees where a rich diversity of species should prevail. Meanwhile, advocates for indigenous peoples, who have witnessed the harm caused by crude industrial logging of natural forests, warn that plantations will dislocate forest dwellers and upset local economies. Pressure from these groups helps explain why the best practices in plantation forestry now stress the protection of environmental quality and human rights. As with most innovations, achieving the promise of high-yield forestry will require feedback from a watchful public.
The main benefit of the new approach to forests will reside in the natural habitat spared by more efficient forestry. An industry that draws from planted forests rather than cutting from the wild will disturb only one-fifth or less of the area for the same volume of wood. Instead of logging half the world’s forests, humanity can leave almost 90 % of them minimally disturbed. And nearly all new tree plantations are established on abandoned croplands, which are already abundant and accessible. Although the technology of forestry rather than the behavior of hunters spared the forests and stags, Hubert would still be pleased.
7. Sparing pavement
What then are the areas of land that may be built upon? One of the most basic human instincts, from the snake brain, is territorial. Territorial animals strive for territory. Maximizing range means maximizing access to resources. Most of human history is a bloody testimony to the instinct to maximize range. For humans, a large accessible territory means greater liberty in choosing the points of gravity of our lives: the home and the workplace.
Around 1800, new machines began transporting people faster and faster, gobbling up the kilometers and revolutionizing territorial organization.[xi] The highly successful machines are few—train, motor vehicle, and plane—and their diffusion slow. Each has taken from 50 to 100 years to saturate its niche. Each machine progressively stretches the distance traveled daily beyond the 5 km of mobility on foot. Collectively, their outcome is a steady increase in mobility. For example, in France, from 1800 to today, mobility has extended an average of more than 3% per year, doubling about every 25 years. Mobility is constrained by two invariant budgets, one for money and one for time. Humans always spend an average 12-15% of their income for travel. And the snake brain makes us visit our territory for about one hour each day, the travel time budget. Hubert doubtless averaged about one hour of walking per day.
The essence is that the transport system and the number of people basically determine covered land.[xii] Greater wealth enables people to buy higher speed, and when transit quickens, cities spread. Both average wealth and numbers will grow, so cities will take more land.
The USA is a country with a fast growing population, and expects about another 100 million people over the next century. Californians pave or build on about 600 m2 each. At the California rate, the USA increase would consume 6 million hectares, about the combined land area of the Netherlands and Belgium. Globally, if everyone new builds at the present California rate, 4 billion added to today’s 6 billion people would cover about 240 million hectares, midway in size between Mexico and Argentina.
Towering higher, urbanites could spare even more land for nature. In fact, migration from the country to the city formed the long prologue to the Great Restoration. Still, cities will take from nature.
But, to compensate, we can move much of our transit underground, so we need not further tar the landscape. The magnetically levitated train, or maglev, a container without wings, without motors, without combustibles aboard, suspended and propelled by magnetic fields generated in a sort of guard rail, nears readiness (Figure 6). A route from the airport of Shanghai to the city center will soon open. If one puts the maglev underground in a low pressure or vacuum tube, as the Swiss think of doing with their Swissmetro, then we would have the equivalent of a plane that flies at high altitude with few limitations on speed. The Swiss maglev plan links all Swiss cities in 10 minutes.[xiii]
Maglevs in low pressure tubes can be ten times as energy efficient as present transport systems. In fact, they need consume almost no net energy. Had Hubert crossed the USA in 1850 to San Francisco from St. Louis on the Overland Stage, he would have exhausted 2700 fresh horses.
Future human settlements could grow around a maglev station with an area of about 1 km2 and 100,000 inhabitants, be largely pedestrian, and via the maglev form part of a network of city services within walking distance. The quarters could be surrounded by green land. In fact, cities please people, especially those that have grown naturally without suffering the sadism of architects and urban planners.
Technology already holds green mobility in store for us. Naturally maglevs want 100 years to diffuse, like the train, auto, or plane. With maglevs, together with personal vehicles and airplanes operating on hydrogen, Hubert could range hundreds of kilometers daily for his ministry, fulfilling the urges of his reptilian brain, while leaving the land and air pristine.
8. Cardinal Resolutions
How can the Great Restoration of Nature I envision be accomplished? Hubert became only a Bishop, but in his honor, I propose we promote four cardinal resolutions, one each for fish, farms, forests, and transport.
Resolution one: The stakeholders in the oceans, including the scientific community, shall conduct a worldwide Census of Marine Life between now and the year 2010. Some of us already are trying.[xiv] The purpose of the Census is to assess and explain the diversity, distribution, and abundance of marine life. This Census can mark the start of the Great Restoration for marine life, helping us move from uncertain anecdotes to reliable quantities. The Census of Marine Life can provide the impetus and foundation for a vast expansion of marine protected areas and wiser management of life in the sea.
Resolution two: The many partners in the farming enterprise shall continue to lift yields per hectare by 2% per year throughout the 21st century. Science and technology can double and redouble yields and thus spare hundreds of millions of hectares for Nature. We should also be mindful that our diets, that is, behavior, can affect land needed for farming by a factor of two.
Resolution three: Foresters, millers, and consumers shall work together to increase global forest area by 10%, about 300 million hectares, by 2050. Furthermore, we will concentrate logging on about 10% of forest land. Behavior can moderate demand for wood products, and foresters can make trees that speedily meet that demand, minimizing the forest we disturb. Curiously, neither the diplomacy nor science about carbon and greenhouse warming has yet offered a visionary global target or timetable for land use.[xv]
Resolution four: The major cities of the world shall start digging tunnels for maglevs. While cities will sprawl, our transport need not pave paradise or pollute the air. Although our snake brains and the instinct to travel will still determine travel behavior, maglevs can zoom underground, sparing green landscape.
Clearly, to realize our vision we shall need both maglevs and the vision of St. Hubert. Simply promoting the gentle values of St. Hubert is not enough. Soon after he painted his masterpiece, Paulus Potter died of tuberculosis and was buried in Amsterdam on 7 January 1654 at the age of 29. In fact, Potter suffered poor engineering. Observe in The Life of the Hunter that the branch of the tree from which the dogs hang does not bend.
Because we are already more than 6 billion and heading for 10 in the new century, we already have a Faustian bargain with technology. Having come this far with technology, we have no road back. If Indian wheat farmers allow yields to fall to the level of 1960, to sustain the present harvest they would need to clear nearly 50 million hectares, about the area of Madhya Pradesh or Spain.
So, we must engage the elements of human society that impel us toward fish farms, landless agriculture, productive timber, and green mobility. And we must not be fooled into thinking that the talk of politicians and diplomats will achieve our goals. The maglev engineers and farmers and foresters are the authentic movers, aided by science. Still, a helpful step is to lock the vision of the Great Restoration in our minds and make our cardinal resolutions for fish, farms, forests, and transport. In the 21st century, we have both the glowing vision of St. Hubert and the technology exemplified by maglevs to realize the Great Restoration of Nature.
Acknowledgements: Georgia Healey, Cesare Marchetti, Perrin Meyer, David Victor, Iddo Wernick, Paul Waggoner, and especially Diana Wolff-Albers for introducing me to Paulus Potter.
Figures
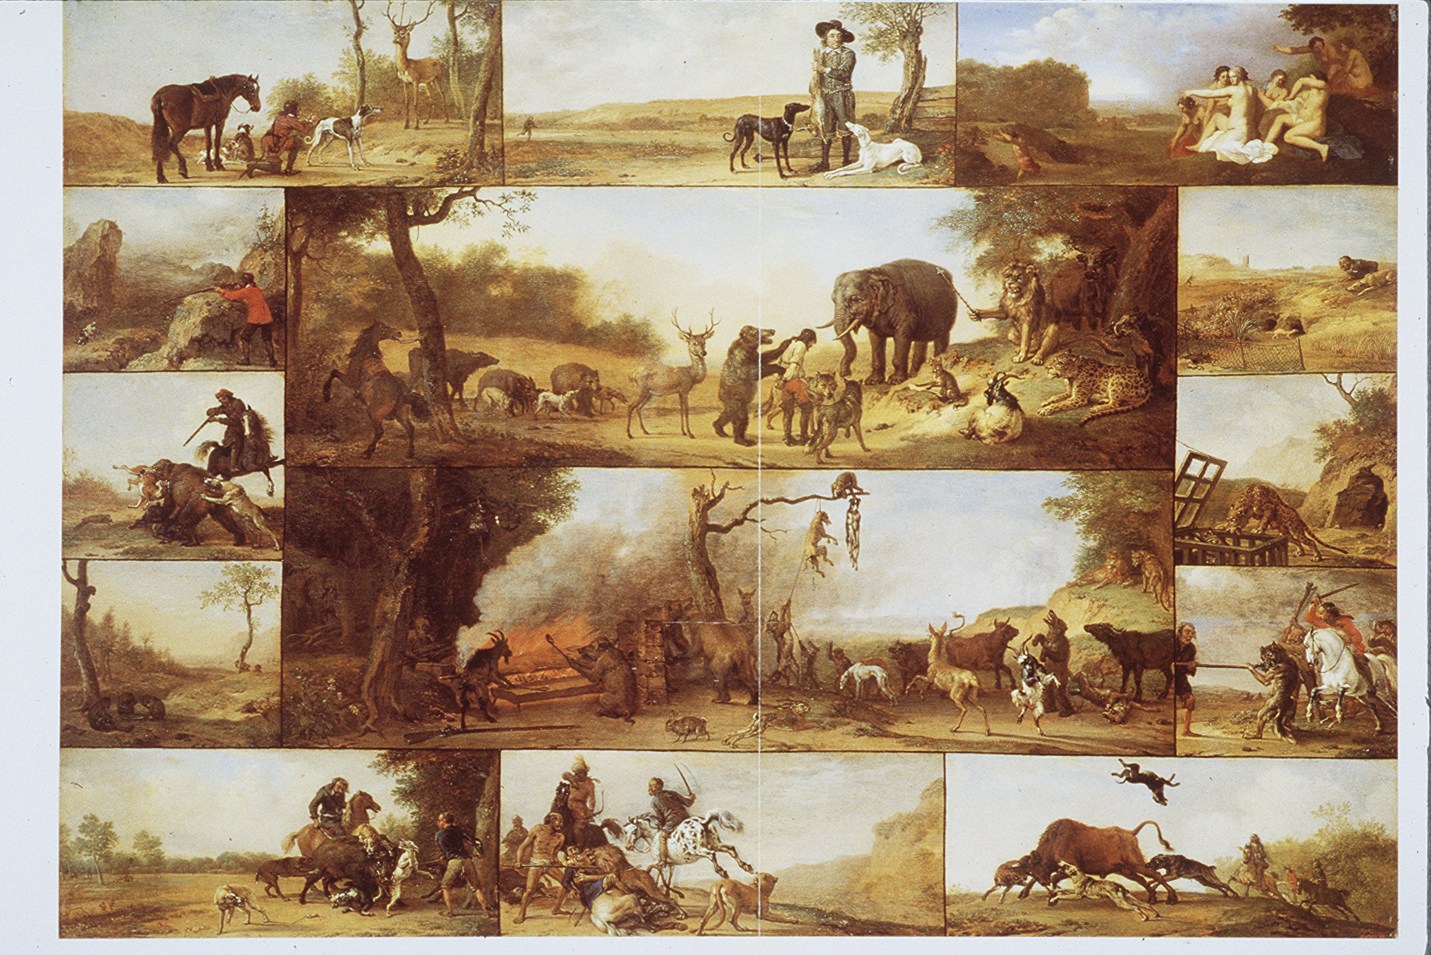
Figure 1. The Life of the Hunter by Paulus Potter. The painting hangs in the museum of the Hermitage, St. Petersburg.
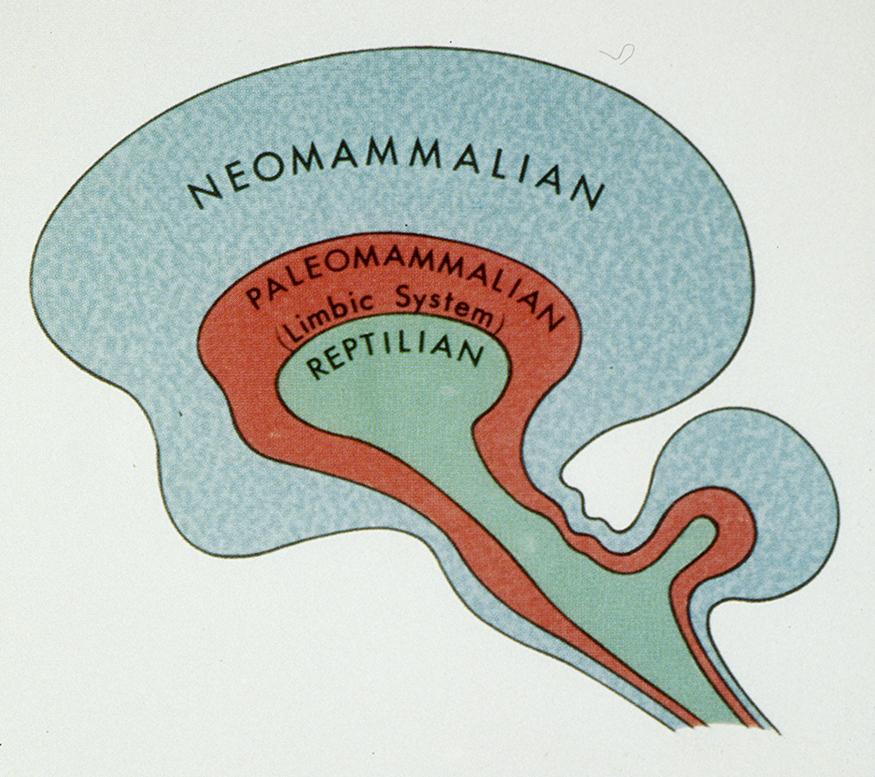
Figure 2. Symbolic representation of the triune brain. Source: P. D. MacLean, 1990.
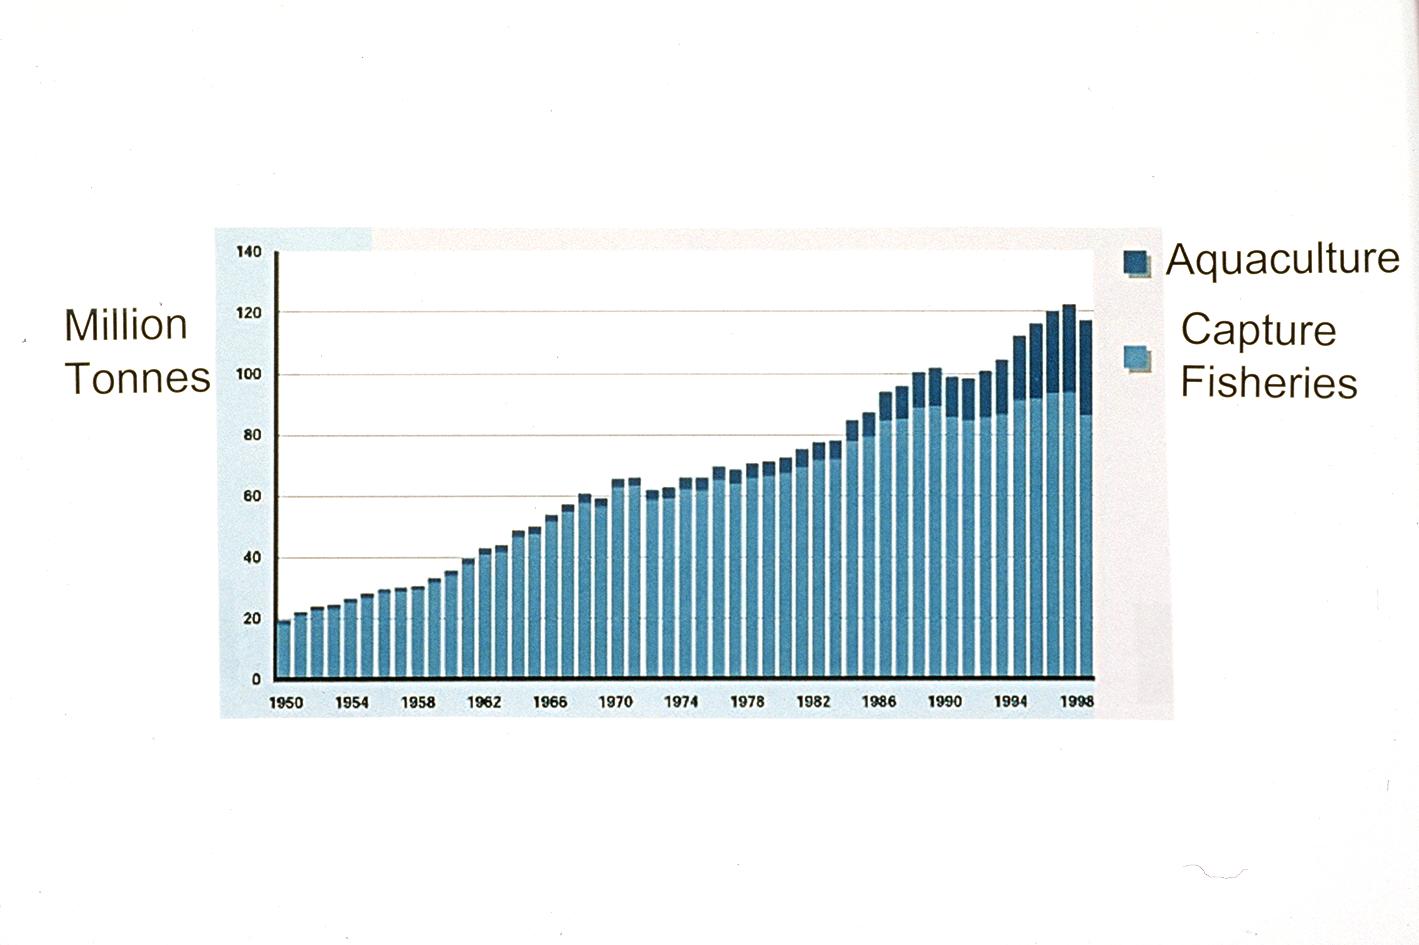
Figure 3. World capture fisheries and aquaculture production. Note the rising amount and share of aquaculture. Source: Food and Agriculture Organization of the UN, The state of world fisheries and aquaculture 2000, Rome. https://www.fao.org/DOCREP/003/X8002E/X8002E00.htm
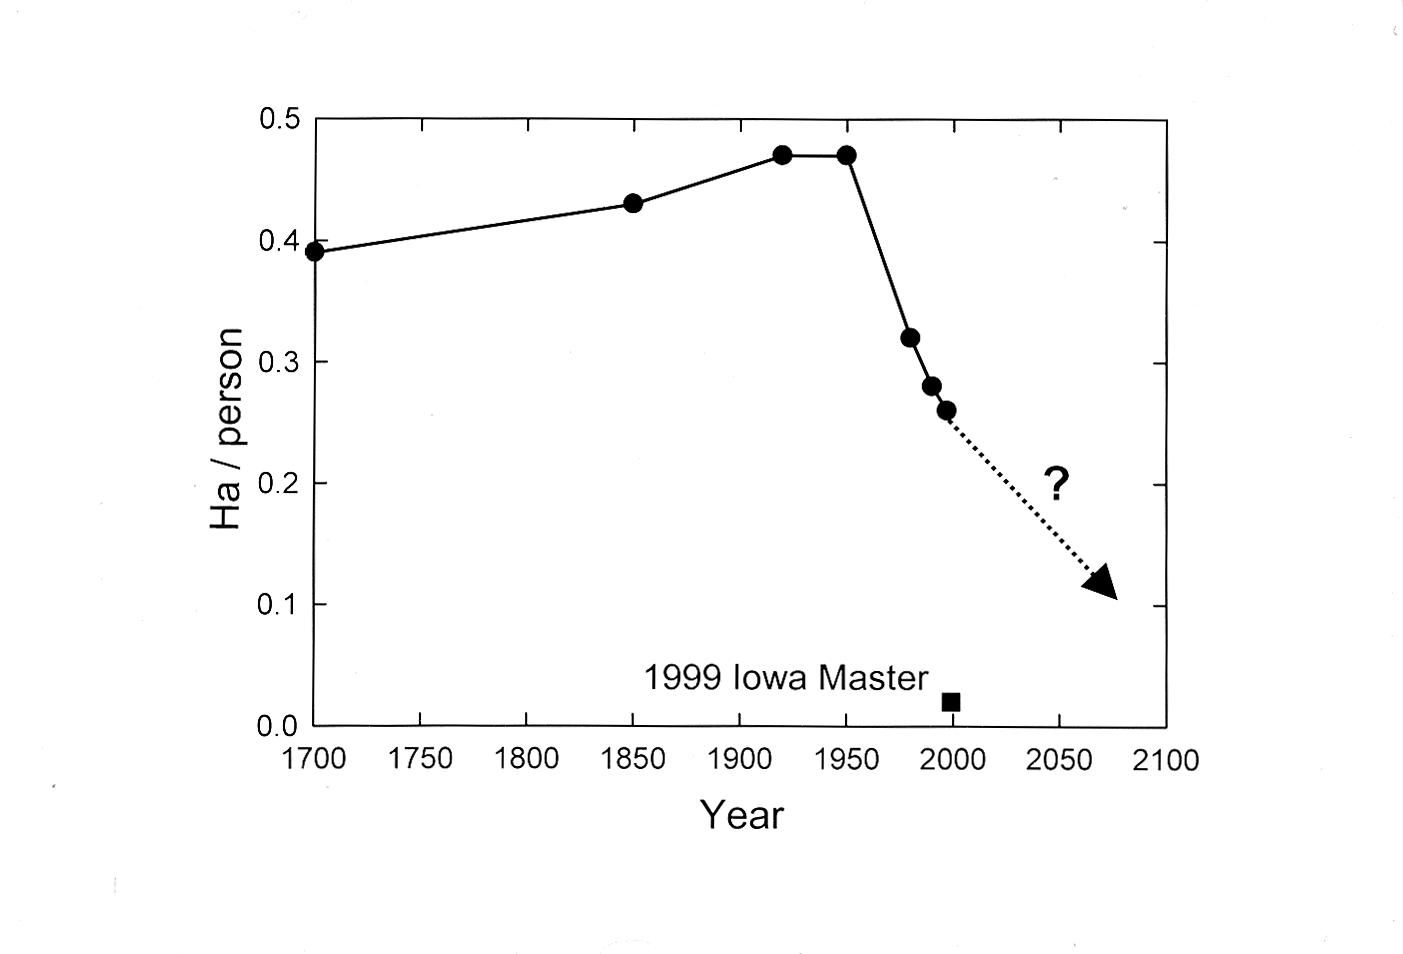
Figure 4. Reversal in area of land used to feed a person. After gradually increasing for centuries, the worldwide area of cropland per person began dropping steeply in about 1950, when yields per hectare began to climb. The square shows the area needed by the Iowa Master Corn Grower of 1999 to supply one person a year’s worth of calories. The dotted line shows how sustaining the lifting of average yields 2 percent per year extends the reversal. Sources of data: Food and Agriculture Organization of the United Nations, various Yearbooks. National Corn Growers Association, National Corngrowers Association Announces 1999 Corn Yield Contest Winners, Hot Off the Cob, St. Louis MO, 15 December 1999; J. F. Richards, 1990, “Land Transformations,” in The Earth as Transformed by Human Action, B. L. Turner II et al. eds., Cambridge University: Cambridge, UK.

Figure 5. Present and projected land use and land cover. Today’s 2.4 billion hectares used for crops and industrial forests spread on “Skinhead Earth” to 2.9 while in the “Great Restoration” they contract to 1.5. Source: D. G. Victor and J. H. Ausubel, Restoring the Forests, Foreign Affairs 79(6): 127-144, 2000.
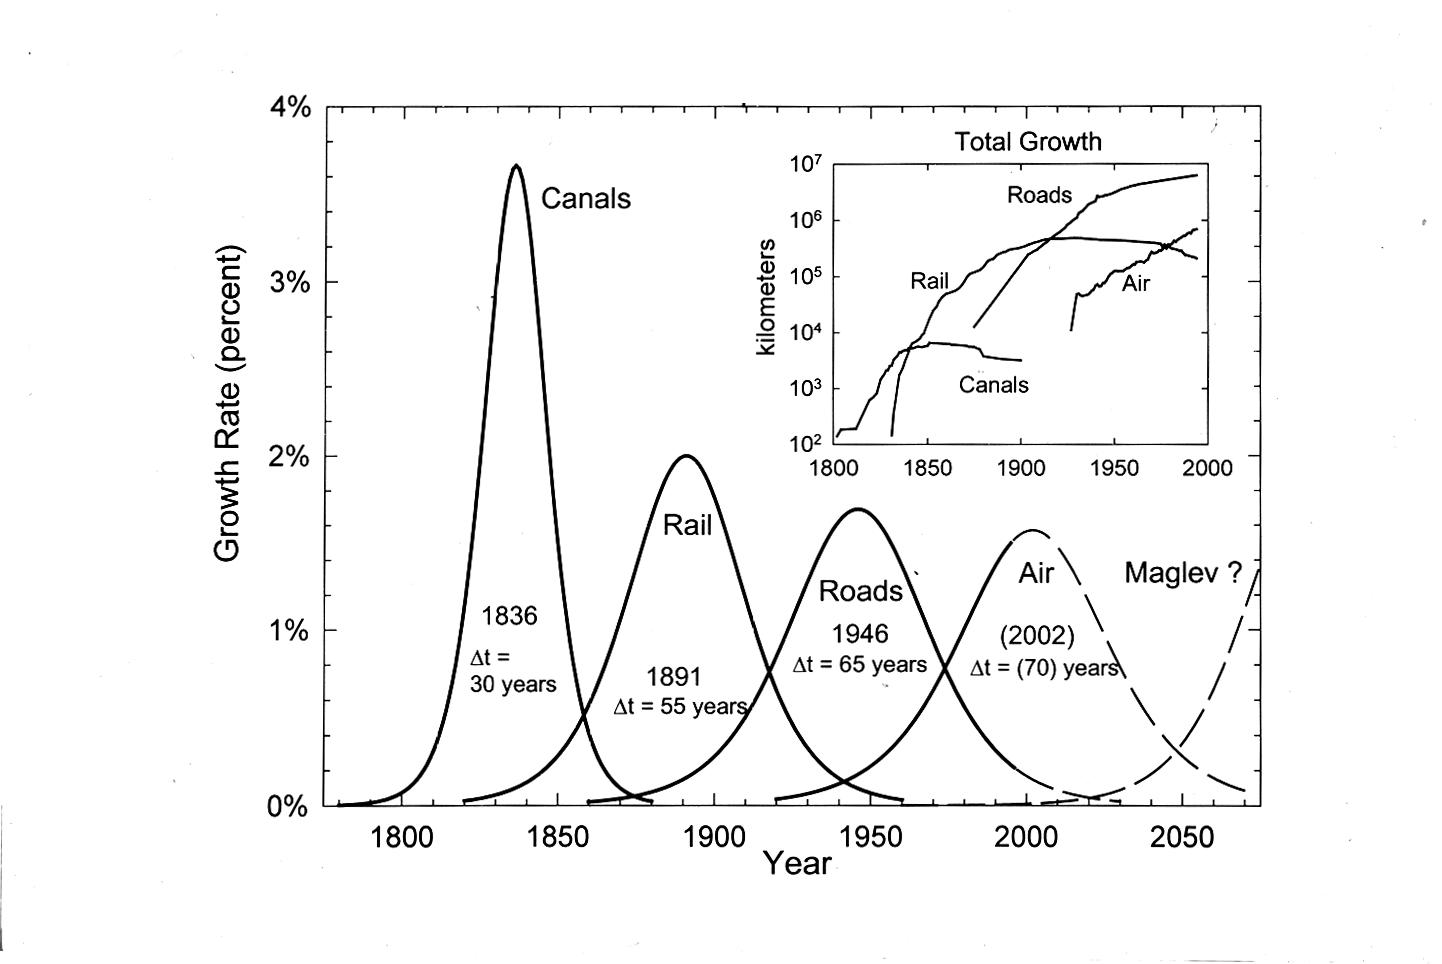
Figure 6. Smoothed historic rates of growth (solid lines) of the major components of the US transport infrastructure and conjectures (dashed lines) based on constant dynamics. Rhythm evokes a new entrant now, maglevs. The inset shows the actual growth, which eventually became negative for canals and rail as routes were closed. Delta t is the time for the system to grow from 10% to 90% of its extent. Source: Toward Green Mobility: The Evolution of Transport, J. H. Ausubel, C. Marchetti, and P. S. Meyer, European Review 6(2): 137-156 (1998).
References and Notes
[i] A. Walsh, E. Buijsen, and B. Broos, Paulus Potter: Schilderijen, tekeningen en etsen, Waanders, Zwolle, 1994.
[ii] The upper right panel shows Diana and Acteon, from the Metamorphosis of the Roman poet Ovid. Acteon, a hunter, was walking in the forest one day after a successful hunt and intruded in a sacred grove where Diana, the virgin goddess, bathed in a pond. Suddenly, in view of Diana, Acteon became inflamed with love for her. He was changed into a deer, from the hunter to what he hunted. As such, he was killed by his own dogs. This panel was painted by a colleague of Potter.
[iii] P. D. MacLean, The Triune Brain in Evolution: Role in Paleocerebral Functions, Plenum, New York, 1990.
[iv] In some fish ranching, notably most of today’s ranching of salmon, the salmon effectively graze the oceans, as the razorback hogs of a primitive farmer would graze the oak woods. Such aquaculture consists of catching wild “junk” fish or their oil to feed to our herds, such as salmon in pens. We change the form of the fish, adding economic value, but do not address the fundamental question of the tons of stocks. A shift from this ocean ranching and grazing to true farming of parts of the ocean can spare others from the present, on-going depletion.
[v] J. H. Ausubel, The Great Reversal: Nature’s Chance to Restore Land and Sea, Technology in Society 22(3):289-302, 2000; M. Markels, Jr., Method of improving production of seafood. US Patent 5,433,173, July 18, 1995, Washington DC.
[vi] Along with its iron supplement, such an ocean farm would annually require about 4 million tons of nitrogen fertilizer, 1/20th of the synthetic fertilizers used by all land farms.
[vii] P. E. Waggoner and J. H. Ausubel, How Much Will Feeding More and Wealthier People Encroach on Nature? Population and Development Review 27(2):239-257, 200.
[viii] G. Leach, Energy and Food Production, IPC Science and Technology Press, Guildford UK, 1976, quantifies the energy costs of a range of food systems.
[ix] I. K. Wernick, P. E. Waggoner, and J. H. Ausubel, Searching for Leverage to Conserve Forests: The Industrial Ecology of Wood Products in the U.S., Journal of Industrial Ecology 1(3):125-145, 1997.
[x] In the United States, for example, leftovers from lumber mills account for more than a third of the wood chips turned into pulp and paper; what is still left after that is burned for power.
[xi] J. H. Ausubel, C. Marchetti, and P. S. Meyer, Toward Green Mobility: The Evolution of Transport, European Review 6(2):143-162, 1998.
[xii] P. E. Waggoner, J. H. Ausubel, I. K. Wernick, Lightening the Tread of Population on the Land: American Examples, Population and Development Review 22(3):531-545, 1996.
[xiii] www.swissmetro.com
[xiv] J. H. Ausubel, The Census of Marine Life: Progress and Prospects, Fisheries 26 (7): 33-36, 2001.
[xv] D. G. Victor and J. H. Ausubel, Restoring the Forests, Foreign Affairs 79(6): 127-144, 2000.
The Evolution of Transport
This paper appeared in the April/May 2001 issue of the magazine The Industrial Physicist, on pages 20-24.
See also:
Toward Green Mobility, the Evolution of Transport, which appeared in the journal The European Review, Vol. 6, No. 2, 137-156 (1998).
Toward Green Mobility: The Evolution of Transport
Summary:
We envision a transport system producing zero emissions and sparing the surface landscape, while people on average range hundreds of kilometers daily. We believe this prospect of ‘green mobility’ is consistent in general principles with historical evolution. We lay out these general principles, extracted from widespread observations of human behavior over long periods, and use them to explain past transport and to project the next 50 to 100 years. Our picture emphasizes the slow penetration of new technologies of transport adding speed in the course of substituting for the old ones in terms of time allocation. We discuss serially and in increasing detail railroads, cars, aeroplanes, and magnetically levitated trains (maglevs).
Introduction
Transport matters for the human environment. Its performance characteristics shape settlement patterns. Its infrastructures transform the landscape. It consumes about one-third of all energy in a country such as the United States. And transport emissions strongly influence air quality. Thus, people naturally wonder whether we have a chance for ‘green mobility’, transport systems embedded in the environment so as to impose minimal disturbance.
In this paper we explore the prospect for green mobility. To this end, we have sought to construct a self-consistent picture of mobility in terms of general laws extracted from widespread observations of human behavior over long periods. Here we describe this picture and use the principles to project the likely evolution of the transport system over the next 50 to 100 years.
Our analyses deal mostly with averages. As often emphasized, many vexing problems of transport systems stem from the qualities of distributions, which cause traffic jams as well as costly empty infrastructures. 1 Subsequent elaboration of the system we foresee might address its robustness in light of fluctuations of various kinds. Although the United States provides most illustrations, the principles apply to all populations and could be used to explain the past and project the future wherever data suffice.
General travel laws and early history
Understanding mobility begins with the biological: humans are territorial animals and instinctively try to maximize territory. 2,3,4The reason is that territory equates with opportunities and resources.
However, there are constraints to range — essentially, time and money. In this regard, we subscribe to the fundamental insights on regularities in household travel patterns and their relationships gained by Zahavi and associates in studies for the World Bank and the US Department of Transportation in the 1970s and early 1980s. 5,6,7,8
According to Zahavi, since ever and in contemporary societies spanning the full range of economic development, people average about 1 hour per day traveling. This is the travel time budget. Schafer and Victor, who surveyed many travel time studies in the decade subsequent to Zahavi, find the budget continues to hover around one hour. 9 Figure 1 shows representative data for studies of the United States, the state of California, and sites in about a dozen other countries since 1965. We take special note of three careful studies done for the city of Tokyo as well as one averaging 131 Japanese cities. 10 Although Tokyo is often mentioned as a place where people commute for many hours daily, the travel time budget proves to be about 70 minutes, and the Japanese urban average is exactly one hour. Switzerland, generally a source of reliable data, shows a 70 minute travel time budget. 11
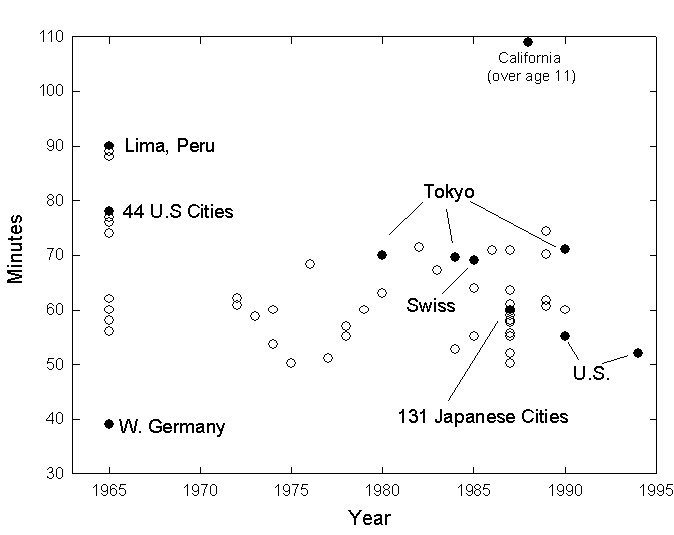
Figure 1 . Travel time budgets measured in minutes of travel per person per day, sample of studies. Sources of data: Katiyar and Ohta 10, Ofreuil and Salomon8,, Szalai et al. 14, US Department of Transportation 33,34, Wiley et al .12,, Balzer 13. Other data compiled from diverse sources By Schafer and Victor 9.
The only high outlier we have found comes from a study of 1987-1988 activity patterns of Californians, who reported in diaries and phone surveys that they averaged 109 minutes per day travelling. 12 The survey excluded children under age 11 and may also reflect that Californians eat, bank, and conduct other activities in their cars. If this value signaled a lasting change in lifestyle to more travel rather than bias in self-reporting or the factors just mentioned, it would be significant. But, a study during 1994 of 3,000 Americans, chosen to reflect the national population, including people aged 18-90 in all parts of the country and economic classes, yielded transit time of only 52 minutes. 13 After California, the next highest value we found in the literature is 90 minutes in Lima, where Peruvians travel from shantytowns to work and markets in half-broken buses.
We will assume for the duration of this paper that one hour of daily travel is the appropriate reference point in mobility studies for considering full populations over extended periods. Variations around this time likely owe to diverse survey methods and coverage, for example, in including walking or excluding weekends, or to local fluctuations. 14
Why 1 hour more or less for travel? Perhaps a basic instinct about risk sets this budget. Travel is exposure and thus risky as well as rewarding. MacLean reports evolutionary stability in the parts of the brain that determine daily routine in animals from the human back to the lizard, which emerges slowly and cautiously in the morning, forages locally, later forages farther afield, returns to the shelter area, and finally retires. 15 Human accident rates measured against time also exhibit homeostasis. 16
The fraction of income as well as time that people spend on travel remains narrowly bounded. The travel money budget fluctuates between about 11% and 15% of personal disposable income (Table 1).
Table 1. Travel expenditures, percent of disposable income, various studies. Sources Of Data: Eurostat 40, UK Department of Transport 41, Schafer and Victor 9, Central Statistics Office 42, US Bureau of the Census 21,28, Zahavi 5; Institut National De La Statistique et des Etudes Economiques 43.
| Country | Year | Percent of Income Spent on Travel |
|---|---|---|
| United States | 1963-1975 | 13.2 |
| 1980 | 13.5 | |
| 1990 | 12.1 | |
| 1994 | 11.4 | |
| United Kingdom | 1972 | 11.7 |
| 1991 | 15.0 | |
| 1994 | 15.6 | |
| West Germany | 1971-1974 | 11.3 |
| 1991 | 14.0 | |
| France | 1970 | 14.0 |
| 1991 | 14.8 | |
| 1995 | 14.5 |
The constant time and money budgets permit the interpretation of much of the history of movement. Their implication is that speed, low-cost speed, is the goal of transport systems. People allocate time and money to maximize distance, that is, territory. In turn when people gain speed, they travel farther, rather than make more trips.
‘Speed’ means inclusive speed, like Darwin’s inclusive fitness. It spans the time from when the traveler leaves home to when she or he walks in the office, for example, including minutes spent waiting for a bus or searching for parking.
On average, people make 3-4 trips per day, rich or poor. 8,17Hupkes asserts a ‘Law of Constant Trip Rates’ as well as travel time. 18 The 3-4 trips per day matter, because they limit the main round trip to 40-50 minutes. Thus, what most people use or access daily is what can be reached in 20 minutes or so.
Passenger fluxes switch by an order of magnitude when crossing the 20-minute boundary. For example, in the old days ferries in Hong Kong between Victoria and Kowloon took about 60 minutes and carried about 300,000 people per day, operating at 30% capacity. When tunnels opened a few years ago, requiring only 5-10 minutes for the underwater crossing, traffic soared to 2 million crossings per day, shocking all the planners. 19 New bridges traversible in minutes have multiplied local traffic ten times in Lisbon and five times in Istanbul.
Just as people average 3-4 round trips per day, they also average 3-4 trips per year outside their basic territory. Trip frequency falls off fast with distance, that is, with travel time. A German even now takes on average one air flight per year. 20 At the height of the rail era, an American took one rail trip each year. 21
Also, people mostly travel to meet people. Of American travel time, about 30 percent is to work, 30 percent for shopping and child care, 30 percent for free-time activities, and the remainder for meals out and other personal care. 22 Moreover, travel is home-centered. In fact, life is home-centered (Figure 2). People spend 2/3 of their time indoors at home. Surprisingly, Californians, for all their avowed love of nature, spend only about 90 minutes each day outside. 12As mentioned earlier, exposure is felt as dangerous. Home-centered trips occupy about 90% of all travel time.
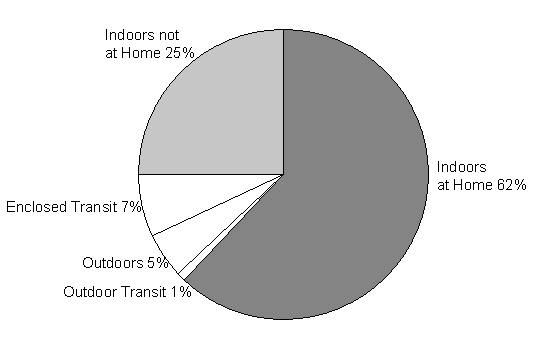
Figure 2 . Percent of time spent in major locations by Californians. Source of data: Wiley et al .12
People also want to return nightly to their home beds. About 60% of all air trips in Europe are businessmen who make a same day return. Given the height of European airfares, these travelers could surely afford to spend the night at their destination, but the gravity of home pulls powerfully.
Given the abiding budgetary laws, why does transport have a dynamic history? While the human brain and thus the time budget may not have changed in a million years, the money budget has, usually upward. During the past 200 years personal income has risen steeply.
With growing wealth, technology introduces faster means. The new modes are faster, but usually not cheaper, especially at the outset, so travelers do not rush to use them. Rather the new means gradually capture the market, as people can afford more, come to be familiar with how a new system operates, and as the system itself improves in many dimensions. The picture is slow penetration of new technologies of transport adding speed in the course of substituting for the old ones in terms of time allocation. Figure 3 shows the story for the United States. US per capita mobility has increased 2.7% per year, with walking included. Excluding walking, Americans have increased their mobility 4.6% each year since 1880. The French have increased their mobility about 4% per year since 1800. 23 We note that the development and diffusion of communication technologies have not lessened the urge to travel or its realization. In fact, better telecommunications systems enable more and faster travel.
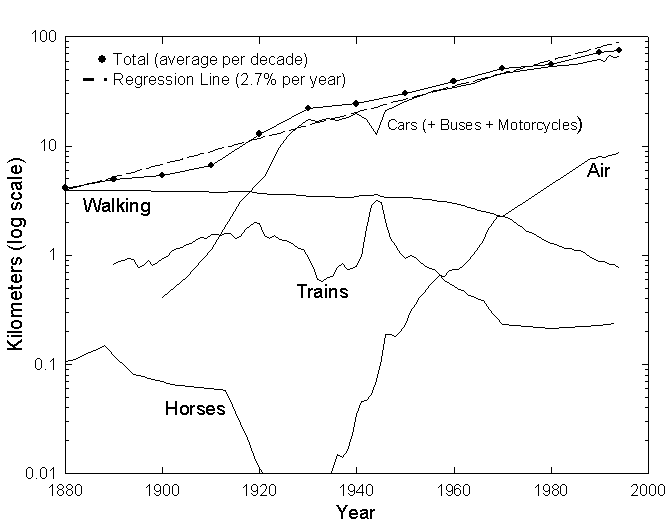
Figure 3 . US passenger travel per capita per day by all modes.
Sources of data: Grubler 23, US Bureau of the Census 21,28, US Department of Transportation 33,35.
Thinking about the evolution of mobility naturally begins with our feet. We used to walk 5 km per day, and now Americans walk perhaps 1 km. In France, mechanical mobility equalled walking only during the 1920s. 23 We walk about 5 km/hour. Walking 5km/hour for 1 hour gives a radius of 2.5 km and an area of 20km 2, the distances which define a village. In fact, the area that can be traversed in one hour with prevailing modes of transport functionally defines a city.
Although tiring, running is three to four times faster than walking and quite reliable for the able-bodied. High speed lasts only an hour or two. The Incas sustained a large empire for centuries on foot, with the furthest outposts 2 weeks from the center for the relay runners.
The wheel greatly enhanced the foot. The wheel multiplies our ability to move goods an order of magnitude over dragging material on poles. Even today human rickshaws carry freight and passengers in Calcutta and elsewhere.
Horses can run faster and longer than people. They can sustain 20 km per hour for several hours per day and reach a speed of 50 km per hour for a few minutes. Horses topped transport for a few thousand years. They made big empires for the Romans, Chinese, and Huns.
Horses also greatly expanded personal territory. The horse, of course, is the image of the American West. Horses were cheap in the United States because they did not compete with people for land for food. In effect, they established the low price of a gallon of gasoline in the United States. The vast American West was quickly divided into territories controlled by ranchers, farmers, and ‘Indians’, all with horses. The story of the village and the Western range show that spatial organization is homothetical to speed available, for all creatures.
Even in the United States, France, and other industrializing countries, horses kept their lead until the middle of the 19 thcentury. Munching hay and oats, horses did 70% of the work in the United States until about 1900. In 1920 America still stabled 20 million non-farm horses, which also produced about half a million tons per day of effluent.
Trains (commercialized about 1830) and motor cars (first produced in the 1890s) displaced horses. 24 Figure 4 shows how canals (on whose tow-paths horses and mules pulled the barges), rails, roads, and airways have successively occupied shares of the overall length of the US transport infrastructure, enabling the sequence of moving technologies. The steady substitution fits closely with a model based on growth and decline following the S-shaped logistic equation. 25 Depiction of the rates of growth of the infrastructure reveals a rhythm to its history peaking in intensity every 50-60 years and gives us confidence for prediction (Figure 5). Let us now discuss serially and in increasing detail the characteristics of the market leaders: railroads, cars, and aeroplanes, and their destined successor, magnetically levitated and driven trains (maglevs).
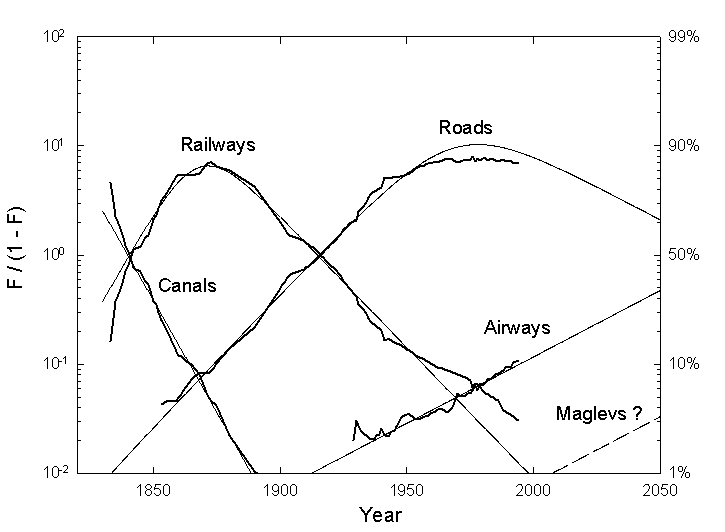
Figure 4 . Shares of the actual total length of the US transport infrastructure (squiggly lines) analyzed with the logistic substitution model (smooth lines). F is the fraction of total length or the market share. The logarithmic scale in the ordinates renders the S-shaped logistic linear. Sources of data: Gruebler 23, US Bureau Of The Census 21,28, US Department Of Transportation 33,34.
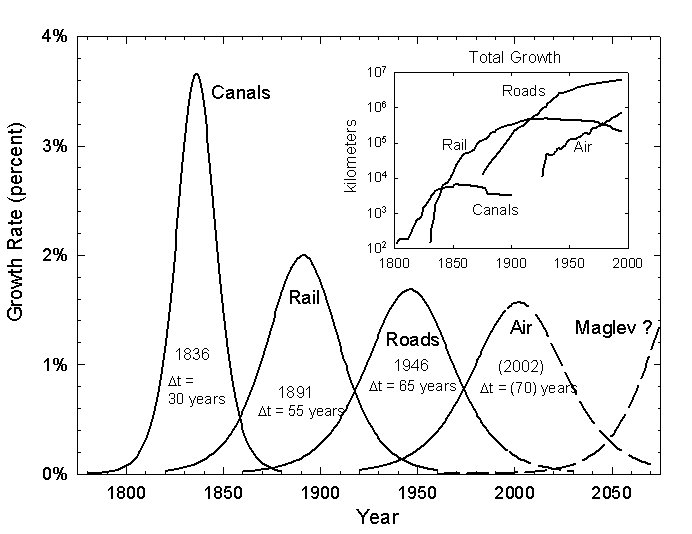
Figure 5 . Smoothed historic rates of growth (solid lines) of the major components of the US transport infrastructure and conjectures (dashed lines) based on constant dynamics. The inset shows the actual growth, which eventually became negative for canals and rail as routes were closed. Delta t is the time for the system to grow from 10% to 90% of its extent. Sources of data: Gruebler 24, US Bureau of the Census 21,28, US Department Of Transportation 33,37.
Railroads
This history of trains emphasize that the roadbed as well as the vehicle changes. The Romans employed a large workforce in making and placing paving stones. In time, we have had wood, cast and wrought iron, and steel rails. On smooth rails, trains required low force (low energy) to pull them and could carry great loads. Low friction also meant high speed.
High speed unified countries. Riding the rails, Garibaldi and Bismarck conducted the formation of Italy and Germany. In the United States the rails ended the functional independence of the States and created the chance to integrate many more. The Golden Spike joining the Pacific and Atlantic rail networks at Promontory Point in Utah in 1869 recognized the unification of the continental United States.
Wood first fired trains. The demand on forests for fuel and ties cleared vast acreages and caused fears of timber famine, even in the United States. 26 Trains could not fulfill their maximum role until coal fuel became widely available, although creosote and other preservatives lessened structural wood demand. Coal’s energy density doubled that of wood, and thus system range and flexibility. Belching coal smoke from steam locomotives became the sooty symbol of travel. In fact, at the time of the break-up of the USSR coal to power the railroads still formed almost half the cargo of the Soviet railroads. Diesel-fueled electric locomotives again doubled the range and halved the emissions of coal and steam. System-wide electrification eliminated the need to carry fuel and centralized the emissions. In France, cheap, smokeless nuclear electricity has helped the train, sometimes ‘a grand vitesse’ (TGV), retain a niche in the passenger transport system.
Although we may think of trains as fast, in practice their inclusive speed has always been slow, because of travel to and from the stations, changes, stops, and serpentine routes. Today European intercity trains still average only about 60 km/hour, measured as air distance between stops. German trains, perceived as efficient, average 65 km/hour with a peak of only 95 km/hour. A TGV may reach 400 km/hour on its rails, but inclusive speed is perhaps half this value.
Trains as we know them today will thus form a small part of future transport. Their slow inclusive speed limits them to low-value cargoes. Making money is easier flying an express letter for $20 than hauling a ton of soybean meal 1500 km by rail from Illinois to Connecticut for the $20. For passengers, the TGVs should probably concentrate on the 200 km range, where a one-hour trip time appears convenient for business travel, and especially on even shorter segments. For the latter, the high speed could quadruple the base territory of daily personal round-trips for working and shopping that the car offers.
Shrinking the present slow rail infrastructure will continue to cause pain, especially in Europe, where it remains pervasive. In France in 1995 the prospect of closing some almost unused rural spurs nearly brought down the government.
Cars
Compared to railroads, cars have the great advantages of no waiting time and no mode change, offset in some places by parking shortages. One could say cars have infinite frequency.
In practice, cars are about eight times as fast as pedestrians. Their mean speed is about 40-50 km/hour, combining inter and intra city. Public vehicles such as buses go about 20 km/hour, or 10 km/hour in midtown Manhattan.
Expanding in linear space 8 times, one acquires about 60 times the area. Cars thus expand territory from about 20 km 2for the pedestrian to about 1200 km 2 for the licentiates. Sixty villages become one town. The car effectively wipes out two levels in the former hierarchy of settlements in which, in Christaller’s classic formulation, clusters of seven (pedestrian) villages support a town, which in turn joins with six other towns to support a city. 27 The car thus reshuffles 60% of the population into larger urban areas.
Because 90% of all passenger kilometers occur within the territorial niche established by the daily travel budgets, the size of the personal niche matters greatly. Eighty percent of all mileage is currently traveled within 50 km of home.
The car is a personal prosthesis, the realization of the “Seven League Boots” that enabled the wearer to cover about 35 km in each step in the fairy story ‘Hop o’ my Thumb’. Although late adopters of new technologies consistently saturate lower than pioneers, car populations seem to saturate at a car for each licensable driver. 23 Perhaps the proportion will rise somewhat as more people acquire second homes.
In the United States, the annual average distance a car travels has remained about 9-10,000 miles since 1935. 21,28The time a car works each day has also remained about 1 hour, so the average speed of a car has stayed constant at about 40 km/hour. Because per capita daily car travel time also does not change with income but stays at just under an hour, gasoline taxes take a larger share of earnings from those who earn less.
Since the 1920s cars have set the tone for travel fuel. Americans now use about 1.5 gallons of gasoline per person daily for travel, the largest single use of energy. In the past 50 years, motor fuel consumption in the United States has multiplied fivefold to about 150 x 10 9 gallon per year, while motor vehicle kilometers multiplied sevenfold. Therefore, fuel economy increased less than 1% per year, although classes of cars show decadel intervals of as much as a 2% per year efficiency rise.
Motor vehicles remain energetically inefficient, so the scope for reducing per car consumption is large. With the numbers of cars saturating in the developed countries and constant driving time and vehicle size, motor fuel consumption in these countries will tend to decrease, with the rate contingent on population change. Inspection of the total passenger kilometers traveled in various modes (Figure 6) confirms that the car (and bus) travel market, while huge, provides little opportunity for growth in fuel deliveries. In the United States, the rise of population at about 1% per year continues to offset roughly the efficiency gains. The taste for large personal ‘sport’ and ‘utility’ vehicles also demands more fuel but will level and perhaps pass. In Europe and Japan, where populations are imploding, market saturation and rising efficiency will shrink car fuel consumption. To sell more energy, oil companies will surely try to market more natural gas and electricity in coming decades.
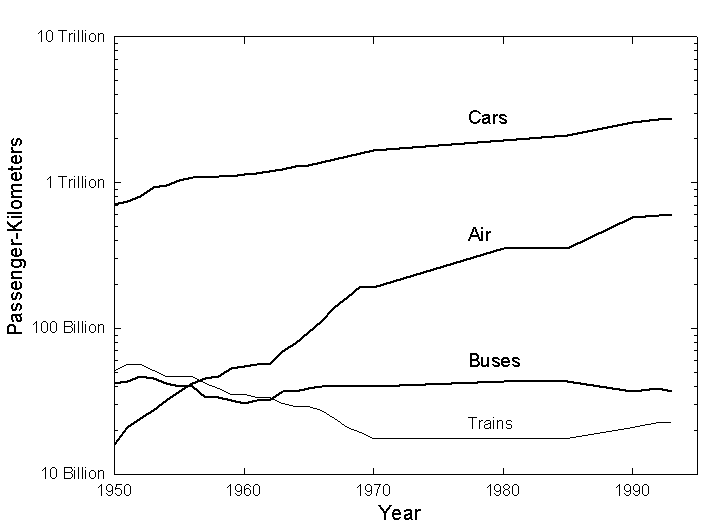
Figure 6 . US domestic intercity passenger travel. Sources of data: US Bureau Of The Census 21,28.
In any case, the population of personal vehicles will remain very large. In the United States it will likely grow from about 200 to about 300 million during the 21 stcentury, as the number of Americans heads for 400 million. Environmentally, the one-license one-car equation means that each car on average must be very clean. Incremental efficiency gains to internal combustion engines will not suffice. The alternative of three hundred million large batteries made with poisonous metals such as lead or cadmium also poses materials recycling and disposal problems.
The obvious answer is the zero-emission fuel cell, where compressed hydrogen gas mixes with oxygen from the air to give off electric current in a low-temperature chemical reaction that also makes water. If refining is directed to the making of hydrogen, its cost should resemble that of gasoline. Moreover, the electrochemical process of the fuel cell is potentially 20%-30% more efficient than the thermodynamic process of today’s engines, an efficiency in line to be attained by the middle of the next century (Figure 7). Daimler-Benz, Ford, and other vehicle manufacturers are already building prototype cars powered by fuel cells. 29 Daimler-Benz plans to begin to penetrate the market within 10 years starting at about 100,000 cars per year. Because of the large, lumpy investments in plant required, the traditional ten-year lifetime of cars, and gradual public acceptance, it will take two to three more decades before the fuel cell cars dominate the fleet. City air, now fouled mostly by cars, could be pristine by the year 2050.
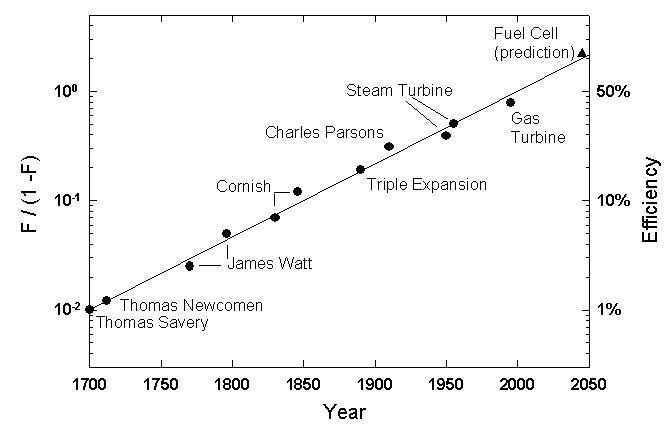
Figure 7 . Improvement in the efficiency of motors analyzed as a sigmoid (logistic) growth process, normalized to 100% of what appears achievable from the actual historic innovations, which are shown. Seventy percent efficient fuel cells, which are theoretically attainable, are due in 2050. After Ausubel and Marchetti 35.
Aeroplanes
Trains and cars seek smooth roadbeds. Flying finesses the problem by smoothing Earth itself, elevating to levels where the mountains and valleys do not interfere. 30 (Marine shipping similarly reduced friction and smoothed coastlines and other terrestrial impediments. For an eccentric exposition, see Ref 30.) For animals, flying is energetically cheaper than running, but requires extremely sophisticated design. Flying has a high fixed energy cost, because support is dynamic. One must push air down to stay up. Energy cost thus depends on time in flight and penalizes slow machines.
So, the successful machines tend to be fast. The mean speed of a plane is 600 km per hour with takeoff and landing, an order of magnitude faster than the intercity trains.
During the past 50 years passenger kilometers for planes have increased by a factor of 50. Air has increased total mobility per capita 10% in Europe and 30% in the United States since 1950. A growth of 2.7% per year in passenger km and of the air share of the travel market in accord with the logistic substitution model brings roughly a 20-fold increase for planes (or their equivalents) in the next 50 years for the United States and even steeper elsewhere. Figure 8 shows the airways heading for half the US market in intercity travel around 2025.
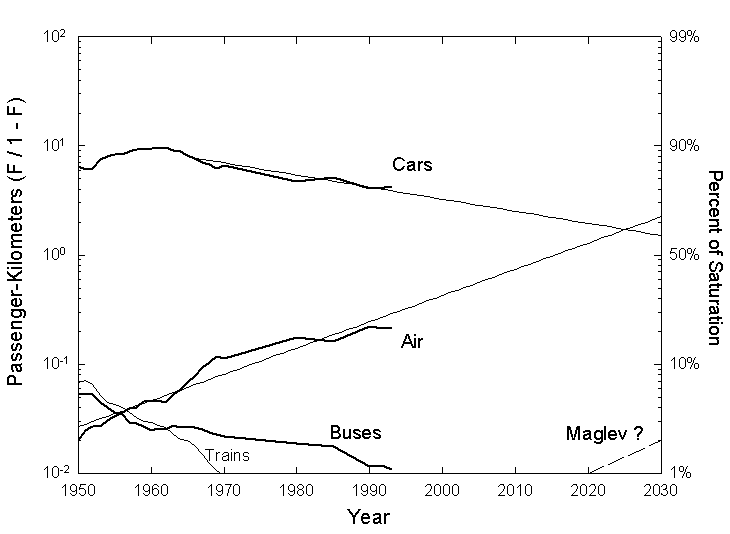
Figure 8 . Shares of actual US domestic intercity passenger travel (squiggly lines) analyzed and extrapolated with the logistic substitution model (smooth lines). The scale used renders the S-shaped logistic linear. Sources of data: US Bureau of the Census 21,28.
Europeans currently travel at about 35 km/hour (or per day, because people travel about 1 hour per day). Of this, Europeans fly only about 15 seconds or 2.5 km per day. A continuing rise in mobility of 2.7% per year means doubling in 25 years, and an additional 35 km per day or about 3 minutes on a plane. Three minutes per day equal about one round-trip per month per passenger. Americans already fly 70 seconds daily, so 3 minutes certainly seems feasible for the average European a generation hence. The jet set in business and society already flies a yearly average of 30 minutes per day. The cost in real terms of air transport is decreasing, so a larger stratum could allocate some share of its money budget to this mode. However, for the European air system the projected level requires a 14-fold increase in the next 25 years or about 12% per year, a hard pace to sustain without a basic rethinking of planes and airport logistics.
One bottleneck is the size of the aeroplanes. Boeing 747s now carry two-thirds of air passenger traffic (in km). The 50-fold increase in traffic has come with a very small increase in the fleet. For a long time the number of commercial aeroplanes was stable around 4000, and in recent years increased to about 5500, many of which are old and small. Nevertheless, commercial productivity in passenger kilometres/hr has soared. Compared with the Queen Mary, a marine alternative for crossing the Atlantic taken out of service in 1967 when the Boeing 747 was about to be introduced, the Jumbo Jet had three times the productivity in passenger km per hour, the same engine power and cost, and 1/100 the crew and weight. The B-747 outperformed its predecessor planes, the B-707 and the DC-8 of the 1950s and 1960s by one order of magnitude and the DC-3 of the 1930s by two orders. To achieve a further order of magnitude growth, the air system requires a 1000-1200 passenger 0.8 Mach plane now and a jumbo hypersonic (greater than Mach 5) soon.
Freight compounds the pressure. Planes started by carrying only the mail and a few pricey people. They have progressively captured lower value goods. (Railroads also started this way and now carry essentially only coal and grain. The declining market for coal will further diminish rail, in turn limiting coal. We wonder how the grain will get around.) Freight still accounts for only 15% of air ton km, so much potential growth remains in the system. The largest air freighter now carries 200 tons. With an increase in traffic, airframe companies will design a variety of planes for freight. One thousand tons seem technically portable. Air freighters could in fact revolutionize cargo transport and reduce the role of the road in long-distance distribution of goods.
As implied, top planes can meet the productivity need in part with greater speed and size. The super- and hyper-sonic machines can work well for intercontinental travel, but at the continental range, noise and other problems arise, especially in the 500-1000 km distances which separate many large continental cities. A single route that carries one million passengers per year per direction, or 30,000 per day, would require 60 take-offs and landings of Jumbos, a lot to add on present airports. Moreover, in our outlook, aeroplanes will consume most of the fuel of the transport system, a fact of interest to both fuel providers and environmentalists. Today’s jet fuel will not pass the environmental test at future air traffic volumes. More and more hydrogen needs to enter the mix and it will, consistent with the gradual decarbonization of the energy system (Figure 9). Still, we clearly need a high density mode having the performance characteristic of top aeroplanes without the problems.
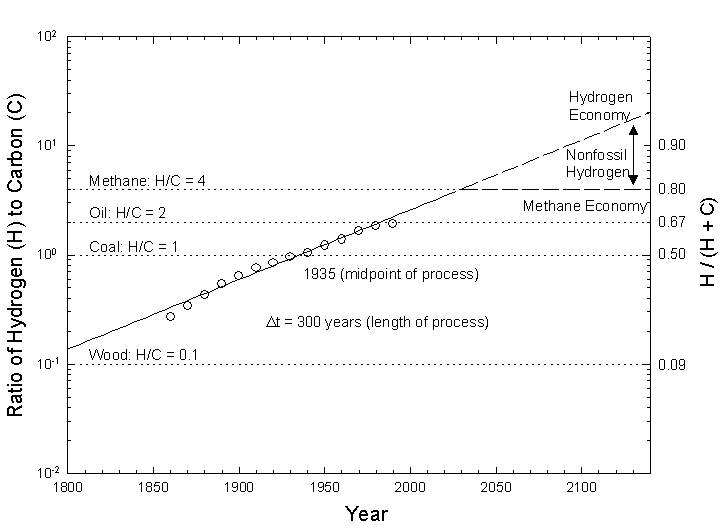
Figure 9 . Ratio of hydrogen (H) to carbon (C) for global primary energy consumption since 1860 and projections for the future, expressed as ratio of hydrogen to carbon (H/(H+C)). The ratio is analyzed as a sigmoidal (logistic) growth process, and is plotted on a scale that renders the S-shaped logistic linear. The projection shows two scenarios: one for a methane economy in which the ‘average’ fuel stabilizes at the H/C ratio of natural gas, and one for a hydrogen economy, in which hydrogen produced by the separation of water using nuclear or solar power would eventually fully decarbonize the energy system. Source: Ausubel 44.
Maglevs
According to our rhythmic historical model (Figure 5), a new, fast transport mode should enter about 2000. The steam locomotive went commercial in 1824, gasoline engine in 1886, and jet in 1941. In fact, in 1991, the German Railway Central Office gave the magnetic levitation system a certificate of operational readiness and a Hamburg-Berlin line is now under construction. 31,32 Maglev prototypes have run up to 600 km/hour.
Maglevs have many advantages: not only high mean speed, to which we will recur, but acceleration, precision of control, and absence of noise and vibration 33,34,. They can be fully passive to forces generated by electrical equipment and need no engine on board. Maglevs also provide the great opportunity for electricity to penetrate transport, the end-use sector from which it has been most successfully excluded.
While resistance limits speed, the induction motors that propel maglevs do not. These motors can produce speeds in excess of 800 km/hour and in low pressure tunnels thousands of km per hr. In fact, electromagnetic linear motors have the capacity to exert pull on a train independent of speed. A traditional electric or internal combustion engine cannot deliver power proportional to speed. In contrast, the new motors allow constant acceleration. Constant acceleration maglevs (CAMs) could accelerate for the first half the ride and brake for the second and thus offer a very smooth ride with high accelerations.
Linear motors can absorb high power, gigawatts for a 100-ton train approaching the centre of its trip. 35 Because the power demand constantly goes from such levels to zero in a matter of minutes, the system places a heavy strain on the electric grid. But, a technical fix may exist. Distributing an energy storage system along the line could largely solve the problem of power. The constant pull force means constant energy per unit distance. The system would store the energy recovered from braking trains locally and re-deliver it to accelerating trains. Recovery could be quite good with linear motors. High-temperature superconductors in fact could permit almost complete energy recovery in deceleration as well as hovering at zero energy cost. The external grid would provide only, on a quasi-continuous basis, the make-up for the losses due to trains, motors, and storage, which could be based on magnetic storage coils in the ground. Such storage systems need research.
High speed does entail problems: aerodynamic and acoustic as well as energetic. In tunnels, high speed requires large cross sections. The neat solution is partially evacuated tubes, which must be straight to accommodate high speeds. Low pressure means a partial vacuum comparable to an altitude of 15 thousand meters. Reduced air pressure helps because above about 100 km per hour the main energy expense to propel a vehicle is air resistance. Low pressure directly reduces resistance and opens the door to high speed with limited energy consumption. Tunnels also solve the problem of landscape disturbance.
For a subsurface network of maglevs, the cost of tunneling will dominate. The Swiss are actually considering a 700 km system. 36 For normal high-speed tunnels, the cross-section ratio of tunnel to train is about 10-1 to handle the shock wave. With a vacuum, however, even CAMs could operate in small tunnels, fitting the size of the train. In either case the high fixed cost of infrastructures will require the system to run where traffic is intense–or huge currents can be created, that is, trunk lines. Because the vehicles will be quite small, they would run very often. In principle, they could fly almost head-to-tail, ten seconds apart.
Acceleration might be limited to 0.5 G or 5 m/s 2, the same as a Ferrari or Porsche (a person feels 1 G lying down on a bed, but the vector is different). In fact, present maglev designs go up to 3 m/s 2. The Six Flags Magic Mountain Amusement Park in Valencia, California, USA is operating a high-tech roller coaster, ‘Superman: The Escape’, 37with a linear induction motor whose cars accelerate passengers with a force up to 4.5 G. Within a couple of seconds the thrill seekers hurtle upward at 160 km per hour. Such playful implementations of maglev technology can be an important signal of public acceptance.
Initially, maglevs will likely serve groups of airports, a few hundred passengers at a time, every few minutes. They might become profitable at present air tariffs at 50,000 passengers per day.
In essence maglevs will be the choice for future Metros, at several scales: urban, possibly suburban, intercity, and continental.
As the Hong Kong tunnel and Lisbon bridge suggest, the key to traffic development is to switch a route functionally from intercity to intracity. If the Channel Tunnel transit time, London-Amsterdam or London-Paris, were to drop to 20 minutes, traffic could rise an order of magnitude, assuming also the fading of the frontier effect, which strongly reduces traffic between cultures. Our picture is small vehicles, rushing from point to point. The comparison is with the Internet — a stream of data is broken down into addressed packets of digits individually switched at nodes to their final destination by efficient routing protocols.
Alternately, the physical embodiment resembles, conceptually, that of particle accelerators, where ‘buckets’ of potential fields carry bunches of charged particles. Maglevs may come to be seen as spin-offs of the physics of the 1970s and 1980s, as transistors are seen as realizations of the quantum mechanics of the 1920s and 1930s.
With maglevs, the issue is not the distance between stations, but waiting time and mode changes, which must be minimized. Stations need to be numerous and trips personalized, that is, zero stops or perhaps one.
Technically, among several competing designs the side-wall suspension system with null-flux centering, developed in the United States by the Foster-Miller company, seems especially attractive: simple, easy access for repair, and is compact. 38 Critically, it allows vertical displacement and therefore switches with no moving parts.
The suspension system evokes a comparison with air. Magnetic forces achieve low-cost hovering. Planes propel by pushing air back. Momentum corresponds to the speed of the air pushed back, that is, energy lost. Maglevs do not push air back, but in a sense push Earth, a large mass, which can provide momentum at negligible energy cost. The use of magnetic forces for both suspension and propulsion appears to create great potential for low travel-energy cost, conceptually reduced by 1-2 orders of magnitude with respect to energy consumption by aeroplanes with similar performance.
Because maglevs carry neither engines nor fuel, the weight of the vehicle can be light and total payload mass high. Aeroplanes at takeoff, cars, and trains all now weigh about 1 ton per passenger transported. A horse was not much lighter. Thus, the cost of transport has mainly owed to the vehicle itself. Maglevs might be 200 kg per passenger. Heavy images of trains and planes continue to haunt discussions of maglevs. In eventual practice, a very light envelope suspended on a moving magnetic field modeled with a computer will surely have very different characteristics from a classic train.
For the intracity maglev, metro stations might be spaced 500 meters apart, with very direct access to trains. Vertical displacement can be precious for stations, where trains would pop up and line up, without pushing other trains around. It also permits a single network, with trains crossing above or below. Alternatively, a hub-and-spoke system might work. This design favors straight tubes and one change.
In Paris, a good Metro city, access to Metro stops is about 5 min on foot, leaving 15-20 min for waiting and travel. Our wagon navigating in a magnetic bucket at 0.5 G constant acceleration could cover 10 km in 1.5 min at a mean speed of 400 km/hour. The trip from Wall Street to midtown Manhattan might be 1 min, while from Heathrow Airport to central London might be 2-3 min. For CAMs transit time grows as the square root of distance, so 500 km might take 10 min and 2500 km 20 min.
Suburban maglevs might go 500 km per hour, a speed requiring 30 s to attain at 0.5 G. At current city densities, this could create functional agglomerations with a 100 km radius and perhaps 150 million people. Stations would serve about 10,000 people.
For the city or suburban model to work, the Internet model is particularly important: information packets called humans sent by a common carrier, starting from various sources and avoiding jams by continuous rerouting. Elevators in busy skyscrapers already prefigure the needed optimization routines.
At intercity and continental scale, maglevs could provide supersonic speeds where supersonic planes cannot fly. For example, a maglev could fuse all of mountainous Switzerland into one functional city in ways that planes never could, with 10 minute travel times between major present city pairs. Alternately, maglevs could functionally expand the area of a city. In fact, settlements seem to be evolving both at micro and macro in the direction of linear or edge cities or corridors, formed by transport and foreseen more than a generation ago in the “ecumenopolis”. 39 This pattern seems well-served by maglevs.
Will CAMs make us sprawl? This is a legitimate fear. In Europe, since 1950 the tripling of the average speed of travel has extended personal area tenfold, and so Europe begins to converge with Los Angeles. The car enlarges the cities but also empties the land. In contrast to the car, maglevs may offer the alternative of a bimodal or ‘virtual’ city with pedestrian islands and fast connections between them.
In a city such as Paris people live in their quarter and regularly or occasionally switch to other quarters. This actual behavior suggests a possible form for future human settlements. ‘Quarters’ could grow around a maglev station with an area of about 1 km 2and 100,000 inhabitants, be completely pedestrian, and via the maglev form part of a more or less vast network providing the majority of city services at walking distance. Quarters need not be contiguous, an architecture inherited from the early pedestrian city, but could be surrounded by green land.
Travelling in a CAM at 0.5 G for 20 minutes, a woman in Miami could go to work in Boston and return to cook dinner for her children in the evening. Bostonians could symmetrically savor Florida, daily. Marrakech and Paris could pair, too. With appropriate interfaces, the new trains could carry hundreds of thousands of people per day, saving cultural roots without impeding work and business in the most suitable places.
Seismic activity could be a catch. In areas of high seismic activity, such as California, safe tubes (like highways) might not be a simple matter to design and operate.
Although other catches surely will appear, maglevs should displace the competition. Intrinsically, in the CAM format they have higher speed and lower energy costs and could accommodate density much greater than air. They could open new passenger flows on a grand scale during the 21 stcentury with zero emissions and minimal surface structures.
Closing Remarks
All the history of transport reduces to the fundamentally simple principle: produce speed technically and economically so that it can be squeezed into the travel money budget. The history of transport technology can be seen as a striving to bring extra speed to the progressively expanding level of income.
By the year 2100, per capita incomes in the developed countries could be very high. A 2% growth rate, certainly much less than governments, central banks, industries, and laborers aspire to achieve, would bring an average American’s annual income to $200,000.
Time, or convenience, determines the volume of traffic. Traffic will be very high if we stay within the traditional budgets, even higher if the relaxation of time budgets permits an increase in travel time, which Californians may foreshadow, or if the share of disposable income allocated to travel trends upward.
Staying within present laws, a 2.7% per year growth means doubling of mobility in 25 years and 16 times in a century.
A century or more is the rational time for conceiving a transport system. The infrastructures last for centuries. They take 50-100 years to build, in part because they also require complementary infrastructures. Railroads needed telegraphs, and paved roads needed oil delivery systems so that gasoline would be available to fill empty car tanks. Moreover, the new systems take 100 years to penetrate fully at the level of the consumer. Railroads began in the 1820s and peaked with consumers in the 1920s.
Fortunately, during the next century we may be able to afford green mobility. In fact, we can clearly see its elements: cars, powered by fuels cells; aeroplanes, powered by hydrogen; and maglevs, powered by electricity, probably nuclear. The future looks clean, fast, and green.
Acknowledgments:
Thanks to the late Robert Herman for many stimulating conversations about travel and behavior, Arnulf Gruebler and Nebojsa Nakicenovic for sharing their analyses of these same questions with us over many years, Eduard Loeser and Andreas Schafer for help with data, and Chauncey Starr and Kurt Yeager for their continuing interest in our work.
References
1R. Herman (1982) “Remarks on Traffic Flow Theories and the Characterization of Traffic in Cities”. In W. C. Schieve, and P. M. Allen (eds.), Self-Organization and Dissipative Structures (Austin, Texas: University of Texas) pp. 260-284.
2R. Ardrey (1986) The Territorial Imperative (New York: Atheneum).
3R. D. Sack (1986) Human Territoriality: Its Theory and History (Cambridge UK: Cambridge University Press).
4C. Marchetti (1994) “Anthropological invariants in travel behavior”. Technological Forecasting and Social Change 47(1), 75-88.
5Y. Zahavi (1976) “Travel characteristics in cities of developing and developed countries”. World Bank Staff Working Paper No. 230, World Bank, Washington, DC.
6Y. Zahavi (1979) The “UMOT” Project. US Department of Transportation Report No. DOT-RSPA-DPD-20-79-3, Washington, DC.
7Y. Zahavi (1981) ‘Travel time budgets in developing countries’. Transportation Research Part A-General 15(1), 87-95.
8Y. Zahavi, M. J. Beckmann, and T. F. Golob (1981) The UMOT/Urban Interactions. US Department of Transportation Report No. DOT-RSPA-DPB-10/7, Washington, DC.
9A. Schafer and D. G. Victor (1997) ‘The Future Mobility of the World Population’. Discussion Paper 97-6-4, Massachusetts Institute of Technology, Center for Technology , Policy, and Industrial Development, Cambridge, MA.
10R. Katiyar and K. Ohta (1993) ‘Concept of daily travel time (DTT) and its applicability to travel demand analysis’. Journal of the Faculty of Engineering of the University of Tokyo 42(2), 109-121.
11Verkehrsverhalten in der Schweiz 1984 (1986) GVF-Bericht 2/86, Bern, Switzerland.
12J. A. Wiley, J. P. Robinson, T. Piazza, K. Garrett, K. Cirksena, Y. T. Cheng, and G. Martin (1991) Activity patterns of California residents , California Survey Research Center, University of California, Berkeley.
13H. Balzer (1995) Report on daily Activities of Americans , NPD Group Inc., Rosemont, IL, 1995 (see also https://www.npd.com); reported in New York Times , 6 September 1995, p. C1.
14A. Szalai, P. E. Converse, P. Feldheim, E. K. Scheuch, and P. J. Stone (1992) The Use of Time: Daily Activities of Urban and Suburban Populations in 12 Countries (The Hague, Netherlands: Mouton).
15P. D. MacLean (1990) The Triune Brain in Evolution: Role in Paleocerebral Functions (New York: Plenum).
16J. G. U. Adams (1990) Transport Planning: Vision and Practice , (London: Routledge & Kegan Paul).
17J. P. Ofreuil and I. Salomon (1993) ‘Travel patterns of the Europeans in everyday life’. A Billion Trips a Day – Tradition and Transition in European Travel Patterns (Amsterdam: Kluwer Academic).
18G. Hupkes (1988) “The law of constant travel time and trip rates”, Futures 14(1), 38-46.
19C. Marchetti (1991) “Building bridges and tunnels: The effects on the evolution of traffic”. In A. Montanari (ed), Under and Over the Water: The Economic and Social Effects of Building Bridges and Tunnels (Napoli, Italy: Edizione Scientifiche Italiane), pp. 189-278.
20International Air Transport Association (IATA) (1995) World Air Transport Statistics, Cointrin-Geneva.
21US Bureau of the Census (1975) Historical Statistics of the United States: Colonial Times to 1970 (Washington, DC: US Government Printing Office).
22J. P. Robinson and G. Godbey (1997) Time For Life: The Surprising Ways Americans Use Their Time (University Park, Pennsylvania: Pennsylvania State University).
23A. Gruebler (1990) The Rise and Fall of Infrastructure: Dynamics of Evolution and Technological Change in Transport (Heidelberg: Physica).
24K. Desmond (1987) The Harwin Chronology of Inventions, Innovations, and Discoveries from Pre-History to the Present Day (London: Constable).
25N. Nakicenovic (1998) “Dynamics and replacement of US transport infrastructures”. In J. H. Ausubel and R. H. Herman (eds), Cities and Their Vital Systems: Infrastructure Past, Present, and Future (Washington, DC: National Academy), pp. 175-221.
26S. H. Olson (1971) The Depletion Myth: A History of Railroad Use of Timber (Cambridge, Massachusetts: Harvard).
27W. Christaller (1933) Central Places in Southern Germany (Englewood Cliffs, New Jersey: Prentice-Hall).
28US Bureau of the Census (1996 and earlier years) Statistical Abstract of the U.S. (Washington, DC: US Government Printing Office).
29P. Hoffman (1997) Hydrogen & Fuel Cell Letter XII(4), 14 April.
30N. Rashevsky (1968) Looking at History Through Mathematics
(Cambridge, Massachusetts: MIT).
31MVP (Versuchs- und Planungsgesellschaft für Magnetbahnsysteme m.b.H) (1997 Die offizielle Transrapid Homepage, URL https://www.mvp.de/, Munich, Germany.
32J. Mika, Transrapid Informations Resourcen Homepage , URL https://transrapid.simplenet.com/, Germany.
33US Department of Transportation (1997) National Transportation Library: High Speed Ground Transportation (Washington, DC: Bureau of Transportation Statistics). Online at URL https://www.bts.gov/ntl/.
34US Department of Transportation (1997) National Transportation Statistics 1997 (Washington, DC: Bureau of Transportation Statistics). Online at https://www.bts.gov/btsprod/nts/.
35J. H. Ausubel and C. Marchetti (1996) ‘Elektron’, Daedalus 125, 139-169.
36M. Jufer (1996) Swissmetro: Wissenschaftliche Taetigkeit der ETH-Lausanne und Zuerich, Hauptstudie-Zwischenbericht Juli 1994-Juni 1996 (Switzerland: ETH-Lausanne), 30 August 1996. URL https://sentenext1.epfl.ch/swissmetro.
37Superman: The Escape (1997) Superman: The Escape Ride Specs Page , URL https://www.sixflags.com/parks/sfmm, Six Flags Theme Park Inc., Valencia, CA.
38US Department of Transportation (1993) Compendium of Executive Summaries from the Maglev System Concept Definition Final Reports , DOT/FRA/NMI-93/02, pp. 49-81, March 1993. On-line at https://www.bts.gov/smart/cat/CES.html.
39C. A. Doxiadis (1974) Anthropolis: City for Human Development (New York: Norton).
40Eurostat (1994) Consumer Expenditure Survey Data, personal communication to A. Schafer (MIT), Luxembourg.
41UK Department Of Transport (1993) National Travel Survey , London.
42Central Statistics Office (1996) Annual Abstract of Statistics (London: Her Majesty’s Statistics Office).
43Institut National De La Statistique Et Des Etudes Economiques (INSEE) (1997) Annuaire Statistique De La France Edition 1997 (Paris.)
44J. H. Ausubel (1996) ‘Can technology spare the Earth?’ American Scientist 84(2), 166-178.