


Next: Taxonomy of bi-logistic curves
Up: The Component Logistic Model
Previous: Visualization of the model
Contents
As it turns out, many growth and diffusion processes are actually made
up of several subprocesses. First, let us consider the case of a
system which experiences growth in two discrete growth phases. Then, we
will extend this to an arbitrary number of phases.
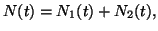
Systems with two growth phases follow what we call the ``Bi-logistic'' model [12]. In this model, growth is the sum
of two discrete ``wavelets''
, each of which is a three-parameter logistic:
 |
(5) |
where
Naturally, we can examine system-level behavior (i.e.,  ), or we
can decompose the model and examine the behavior of the discrete
components (either
), or we
can decompose the model and examine the behavior of the discrete
components (either  or
or  ). In fact, we can plot
and on the same axes, and moreover we can compare
two disparate wavelets by normalizing them with the Fisher-Pry transform.
). In fact, we can plot
and on the same axes, and moreover we can compare
two disparate wavelets by normalizing them with the Fisher-Pry transform.
Next: Taxonomy of bi-logistic curves
Up: The Component Logistic Model
Previous: Visualization of the model
Contents
Jason Yung
2004-01-28
![$\displaystyle N_1(t)= \frac{\kappa_1}{1 + \text{exp} \left[ {-\frac{\ln(81)}{\Delta t_1}}(t -t_{m1}) \right] }$](img28.png)
![$\displaystyle N_2(t)= \frac{\kappa_2}{1 + \text{exp} \left[ {-\frac{\ln(81)}{\Delta t_2}}(t -t_{m2}) \right] }$](img29.png)