Citation: Journal of Forestry 98 (10): 8–14 2000
Despite increases in the nation’s population, affluence, and timber removals, US forest area has remained constant and timber inventory has risen 30 percent since 1952. Industrial ecology, which analyses the flow of timber through systems of production and consumption, seeks to explain how that happened; it also shows the leverage that consumers, millers, and foresters have to reduce harvested area and continue the rebirth of the American forest. Changes in demand by consumers, wood utilization by millers, and management by foresters can help conserve forests for uses other than timber. Of the three actors, however, foresters can exert the most leverage—by increasing the growth rate of trees.
America has more trees today than 100 years ago,” reads an International Paper advertisement in the March 1998 issue of the Journal of Forestry. In a nation that has tripled its population, multiplied its gross domestic product (GDP) 16 times, and uses more timber than any material but sand and gravel, the ad asks, “How did that happen?” We use industrial ecology, the analysis of the flow of material through systems of production and consumption, to answer the question and locate the point of greatest leverage for conserving forests and their benefits (Wernick et al 1998).
This study looks strictly at the number of hectares harvested to satisfy society’s need for timber. Timber harvesting affects the wildlife and recreational services provided by the forest and the integrity of the forest as ecosystem. Harvesting timber from less area leaves more for the other benefits that forests provide. Though it is an imperfect measure, we agree with Hyde (1997) that, on the whole, the area harvested provides the best single proxy for environmental impact.
A range of human activities–from consumption and disposal back to processing and forestry–all contribute to the area of the forest harvested. In their decisions about construction, packaging, communication, recycling, and energy, consumers decide how much wood must be delivered to them. Through efficient timber utilization for forest products, millers can reduce the need to fell trees for processing. Finally, by growing the trees and supervising their harvest, foresters determine how much forest must be harvested to deliver the timber that the mills need.
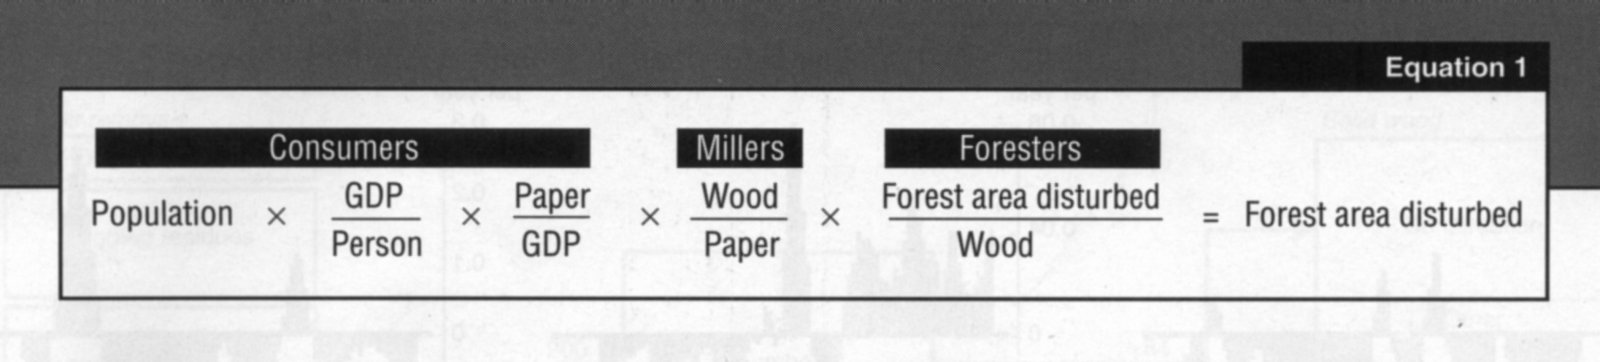
To understand how the three actors affect the flow of forest products and measure their leverage for reducing the area harvested, we use an identity to isolate each actor’s role for individual products (i.e., solid wood, paper, fuel). For paper, for example, equation 1 illustrates how the forest area disturbed is determined by the number of consumers x their share of GDP x the sheets of paper per GDP x the amount of wood a miller uses to make a sheet of paper x the forest area harvested for that wood.
Keywords: Forests, land use, agriculture, wood products, forestry
Areas of Research: Forests, Farms and Materials
Consumers
The past century. In the United States, absolute timber consumption for products and fuel grew 70 percent between 1900 and 1993 (US Bureau of the Census 1975, 1996). Including the use of residues, consumption of wood for pulp exceeded that for lumber, which stayed nearly level. Fuelwood consumption nearly disappeared only to reemerge during the Depression and the oil shocks of the 1970s. Plywood and veneer consumption began to account for a little under 10 percent of the processed harvest in the early 1990s.
The annual percentage change of the national consumption of each of these products is approximately the sum of the small percentage changes in the first three components of equation 1. In the equation, consumers’ leverage the flow of forest products with their numbers (population), wealth (GDP per capita), and the amount of product consumed per dollar of GDP. Industrial ecologists call the amount of product consumed per dollar of GDP “intensity of use” (IOU). The difference between changes in population plus wealth on the one hand, and the national consumption on the other is the IOU. This factor gauges how large a part forest products played in national economic activity as represented by the GDP.
From 1900 to 1993, American population tripled, rising an average 1.3 percent per year. The annual growth of the GDP per person fluctuated, from -4 percent entering the Depression to more than +8 percent in the following decade; the annual average for the century was 1.7 percent. Combined, growing population and personal wealth raised GDP 16 times, an average of 3 percent per year. But the 70 percent rise in timber consumption from 1900 to 1993 corresponds to an annual increase of only 0.5 percent. The IOU, which represents the difference, thus fell an average of 2.5 percent per year.
What changes timber IOU? Constant IOU means that consumption rises in tandem with the rise of population and personal wealth. For example, 2 percent more people and 2 percent more GDP per person would raise consumption 2 + 2 + 0, or 4 percent. If paper use grows faster than the economy, however, and the IOU for paper goes up by 2 percent each year, then consumption rises 2 + 2 + 2, or 6 percent. If paper use slows relative to the economy and the IOU falls 2 percent per year, then consumption rises only 2 + 2 – 2, or 2 percent.
With rare exceptions, during the 20th century the IOU for solid wood products fell (fig. 1, p. 10). Steel, concrete, and plastic became substitutes for wood in certain structures, furniture, barrels, and cross ties. New preservatives for wood prevented fire and decay. Such changes helped lower the IOU for solid wood.
Early in the century US paper use grew dramatically, raising the IOU of pulp even during the Depression. Beginning in the late 1930s, the IOU for pulp fell sharply as the wartime economy lifted GDP faster than paper consumption. Following a burst after the war, the IOU for pulp fell and has been falling since. Because we calculated the IOU only from the industrial roundwood that millers used for solid wood products and paper, more efficient utilization by millers deserves some of the credit for lowering the IOU we calculated (see note in figure 1). By the early 1990s, the falling IOU of pulp actually overcame the growing population numbers and affluence to reduce pulpwood consumption.
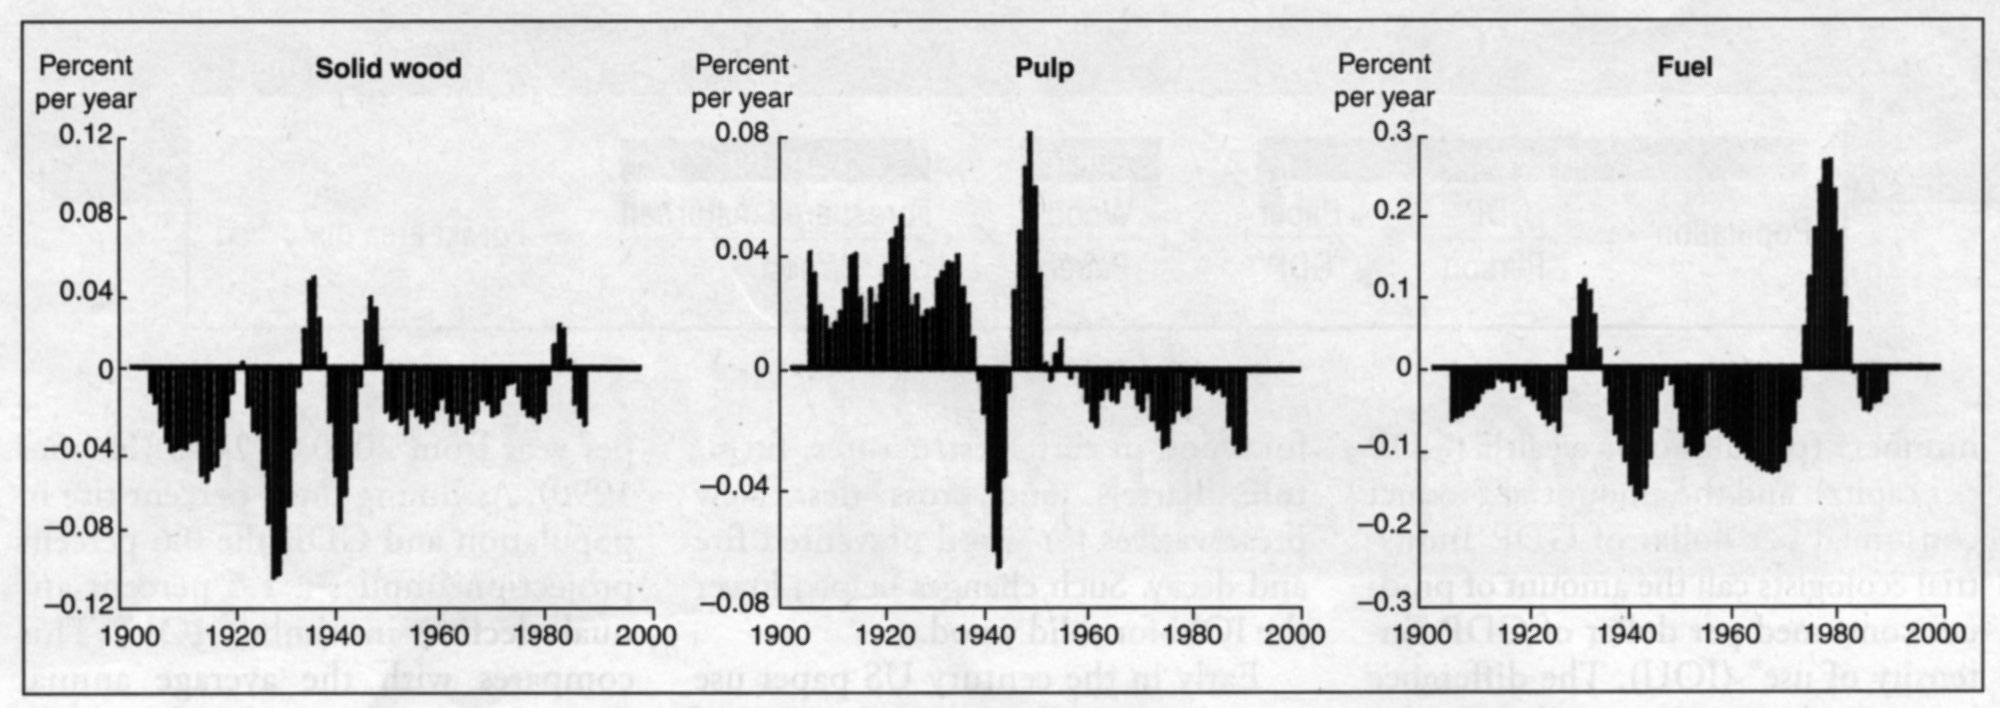
Figure 1. Relative annual percentage changes in intensity of use (IOU) of roundwood used for solid wood, pulp, and fuel. IOU is amount of product divided by GDP. Sources: US Bureau of the Census 1975, 1996; USDA 1993. Note: The data represent the industrial roundwood used for the product itself. Intensity of use goes up with consumer demand but is moderated by increases in efficient utilization; the graph incorporates both effects.
Use of fuelwood fluctuated dramatically over the century. Early in the 1900s, the growing use of coal and oil lowered fuelwood IOU. Then, during the Depression fuelwood IOU soared, only to fall steadily until the mid 1970s, when oil shocks again encouraged the burning of fuelwood.
This next century. Population projections for the next 5 0 to 100 years in the United States range from 0.3 to 0.7 percent per year (US Bureau of the Census 1996). From 1985 to 1995 annual per capita GDP grew an average of 1.3 percent per year-a bit slower than the 1.7 percent average since 1900. The combined growth of population and GDP per person can reasonably be projected to be about 2 percent per year.
After considering trends in industrial production and consumer demand, the USDA Forest Service projects national timber consumption for products to grow about 0.6 percent per year from 2000 to 2040 (Haynes 1990). Assuming the 2 percent rise in population and GDP, the 0.6 percent projection implies a 1.4 percent annual decline in timber IOU. This compares with the average annual drop of 1.8 percent in IOU from 1985 to 1995 and the 20th-century average of -2.5 percent. If consumers continue the long-term 2.5 percent drop in IOU, they could counter the 2 percent rise in population and wealth and reduce timber consumption 0.5 percent annually.
Millers
The past century. In equation 1, millers exert their leverage by changing wood per product in the flow volumes depicted in figure 2 (p. 11). In 1993, 646 million cubic meters of wood and fiber entered the US forest product sector. Trees furnished 78 percent, recycling 10 percent, and imports 12 percent. Other removals (i.e., timber from thinnings or land-clearing operations) and logging residues never entered the commercial flow. Mills consumed 26 percent for solid wood products, 26 percent for paper, and 36 percent for fuel 10 percent was exported. The dotted lines in the center column show the flow of residues in mills, primarily for paper and fuel. To transform logs into lumber efficiently, Millers took advantage of sophisticated new scanning and cutting technologies and sharper, more stable blades (Haynes 1990). They raised the ratio of lumber to roundwood from 33 percent in 1970 to 42 percent in 1993. The volume of unused residue has fallen about 30 million cubic meters since the 1950s. Since 1970, the residues lost in making lumber fell from over 25 percent to 2 percent. Stretching the value of each log and each hectare, Millers also developed composite products like oriented strand board that use irregular wood shapes as well as previously unused tree species.
Figure 2. Flow of forest products, in millions of cubic meters, in the United States in 1993. We use volume instead of mass to eliminate variables like changing moisture content, mineral fillers, and synthetics in products; I cubic meter of wood is considered equivalent to 0.5 metric ton of paper. The dotted rules show the flow of residues in mills. Notes: Timber removals are based on the ratio of logging residues (15.1 percent) and other removals (6.6 percent) to all removals for 1991. Dashed lines represent recycled paper. Construction includes millwork, such as cabinetry and moldings. Other paper and board includes industrial uses, such as materials handling, furniture, and transport. Fuel: The ratio of end uses relies on Btu data from the Energy Information Administration; fuel includes 100 million cubic meters burned by paper mills for energy. Residential and commercial fuel includes electric utilities. Sources: Ince 1994; Energy Information Administration 1994; USDA 1993; US Bureau of the Census 1996; American Forest & Paper Association 1995; Smith et al. 1994; and data from the Engineered Wood Products Association, Tacoma, Washington; and the Western Wood Products Association, Portland, Oregon.
Including fuelwood, residues, and pulping liquors, 47 percent of the US timber harvest in 1993 became useful energy. In fact, US lumber and plywood mills generated over 72 percent of their energy internally-by 1991 (Energy Information Administration 1994). Outright harvest for fuel has remained a relatively steady percentage of harvest since rising to about 15 percent in the early 1970s. Currently, about three-quarters of fuelwood harvest comes from non-growing stock.
In the forest products sector overall, had the log-to-lumber efficiency remained at -1970 levels, meeting 1993 market demand would have required 48 million cubic meters more timber. Without composites displacing lumber, an additional 32 million cubic meters of roundwood input would have been required. Finally, improved efficiency in papermaking spared 34 million cubic meters of material input in satisfying 1993 demand. Their virtual elimination of waste since 1970 leaves millers with the challenge of transforming the near half of wood that is burned into more valuable products.
This next century. On top of raising their efficiency, millers can use substitutes for pulp, such as wastepaper and crops. The recovery and use of wastepaper have increased, and the first facilities are now becoming operational to make newsprint from such crops as kenaf (Kafus Industries 1999). Furthermore, by incorporating organic .and mineral fillers into products, millers can also lower the input of timber. Other substitutions offered by manufacturers and accepted by consumers include polyethylene for paper bags, concrete for rail ties, and steel beams for wooden rafters.
Foresters
The past century. The foresters’ parameter in equation I is the hectares of forest disturbed per cubic meter of wood harvested. A forester can maximize timber yields and minimize area disturbed in three ways: (1) harvesting more of each tree, (2) harvesting more trees on each hectare, and (3) increasing annual tree growth.
1. The roughly two-thirds of the dry matter above the stump in sterns generally sets the limit on how much of each tree is harvested. From 1952 to 1991 logging residues as a percentage of timber removals from growing stock fell from 10 percent to 7.5 percent for softwoods and from 22 percent to 12 percent for hardwoods (Haynes et al. 1995). Because removing vegetation also removes nutrients and because stems are poor in nutrients, harvesting more than stems can deplete a site. Considering the already high harvest index and the nutrient depletion from x raising the index further, foresters have little opportunity to get more wood by harvesting more of each tree.
2. Harvesting more trees on each hectare means less partial cutting, more clearcutting. In the 1980s, partial cutting accounted for three-fifths and clearcutting for two-fifths of the 4 million hectares affected by harvest nationally (W. Brad Smith 1997, pers. commun.). Because 1991 roundwood removals were about 500 million cubic meters, loggers obtained an average of roughly 125 cubic meters of timber for roundwood products for every hectare of timberland harvested. Compared with clearcutting, partial cutting affects appearance less, but harvesting the same volume of timber requires more roads to reach a wider area and counters the objective of disturbing less area.
Concentrating harvest on fewer hectares by cutting more per hectare shrinks the area disturbed nationally. The result is tree plantations, and such concentrations of single species can encourage pests. The attack by fungi and insects in Connecticut plantations of red pine brought from Europe is an example. But the epidemics that removed native chestnut, elm, and hemlock from heterogeneous forests in the same state show that heterogeneity is no guarantee against disaster. The values of homogeneous plantations for wildlife habitat and aesthetic experiences are another concern, but in northeastern Minnesota 53 conifer plantations that were 30 years old, the overstory produced the intended timber, and the understory resembled that beneath naturally regenerated and mature forests (Ohmann 1984).
Plantations allow concentrated harvests. In the South, which contains more than half of the nation’s industrial forestdand, one-eighth of all timberland is now plantations, and that proportion is expected to double by 2030 (Environmental Defense Fund et al. 1995). This expansion of plantations and clearcutting should increase the harvest per hectare and I shrink the area annually disturbed by harvesting. Changing social preferences in recent decades, however, have made the lever of harvesting more trees per hectare more difficult to apply.
3. Increasing the annual tree growth is forestry’s third way to shrink the area disturbed by harvest. At the present average growth rate for growing stock of 3 cubic meters per hectare per year, almost the entire 200 million hectares of American timberland is required to supply the 500 million cubic meters harvested. If foresters achieved annual productivity of 5.9 cubic meters per hectare on appropriately productive sites, they could provide the needed 500 million cubic meters on just 23 percent of US timberland.
Yields can be raised. On industry-owned forests, yields exceed by half those on national forests and private nonindustrial land (Haynes 1990 Powell et al. 1993). Nationally, although the forest industry owns only about one-seventh of timberland, it produces a fifth of national timber growth, a quarter of softwood growth, and about a third of the annual harvest. Here are two other statistics that indicate industry’s disproportionate contribution: Industrial foresters did more than 40 percent of the planting and 70 percent of the stand improvement in 1995 (Moulton et al. 1996).
This next century. Although the forest industry actively manages its own lands, private owners, who control more than half of all American timber land, may lack incentives to do so. Millions of acres await even rudimentary management measures. In the late 1970s, Burwell (1978) argued that millions of acres of forest were underutilized:
In this context the term “underutilized” refers to the practice of minimum management of privately owned forest for many millions of acres. Some significant fraction of this area is never harvested, and mature trees, both merchantable and cull, topple and decay. For a larger fraction of the acreage, merchantable stemwood is periodically harvested but not replanted, the woody residues and dead stemwood arc not removed, and growing cull trees are left to expand their area of coverage.
Burwell’s observation remains apropos today and can also apply to acres released from crops by rising agricultural yields since the 1970s. Given sufficient resources, conventional management of neglected stands offers foresters a great opportunity to raise average yields.
Foresters already possess the means to increase yields. Improving drainage of Southern pines at planting time increased their height after 25 years. About one-tenth of the additional height was due to bedding and weed control, a third to water control, and half to phosphate fertilization (Allen et al. 1990). Foresters can plant species that grow faster than the average annual 3 cubic meters. To illustrate the potential for higher yields, we note that red alder grows biomass as fast as 26 tons per hectare per year, yellow poplar 24, and Western hemlock 38 (Grier et al. 1989). A national consensus would encourage corporations and state and federal agencies to improve average yields with best management methods. The first step toward reaching that consensus is for diverse stakeholders to recognize the unique leverage that higher yields offer to reduce overall forest disturbance.
The forester’s parameter in the flow of forest products is wood per hectare of forest and thus the area disturbed per cubic meter of wood harvested. Among the three levers-harvesting more of each tree, cutting more trees on each hectare, and increasing the annual growth of trees-the best opportunity for reducing the area harvested lies in growing more wood per hectare.
Conclusion
By the end of the 19th century, population growth, increasing wealth, the Industrial Revolution, and expanding agriculture had shrunk the expanse of US forests about 30 percent from the pre-European settlement condition. Although population and wealth continued to multiply, the conservation movement and technological developments beginning early in the 20th century combined to halt the clearing of forests and allowed forest regeneration. Former pastures in New England and the upper Great Lakes states are now mature forests. Expanding exurbs, contracting agriculture, and new logging will all affect future forest clearing (Waggoner et al. 1996). Will consumers, millers, and foresters use their leverage to lessen such disturbances and continue the rebirth of the American forest?
Consumers spare forests by recycling fiber to paper mills, and more importantly, lowering national intensity of use. Millers already use about 120 million fewer cubic meters of roundwood a year than they did three decades ago; further innovations may allow millers to profit more from each unit of timber and spare still more hectares by channeling residues burned as fuel to producing composites and paper. Foresters have the most dramatic opportunity to reduce the hectares harvested-not by harvesting more of a tree or even more trees per hectare, but by increasing the growth rate of trees per hectare. They can narrow the gap between the potential of American timberland and the current low growth rate through improved management of neglected stands and intensive silviculture to raise yields.
American history hints that reducing wood demand as the economy grows, utilizing wood more efficiently, and raising yields can decouple the need for land from timber demand. A plausible 2.5 percent per year drop in intensity of use coupled with an annual I percent rise in yield would shrink the forest area disturbed by logging by 1.5 percent annually. Compounded, that 1.5 percent would reduce the spatial extent of logging by half in 50 years. The benefits of such sustained diligence include preserving a national treasure, sparing land for undisturbed nature, and sequestering carbon from the atmosphere.
Literature Cited
ALLEN, H.L., P.M. DOUGHERTY, and R.G. CAMPBELL. 1990. Manipulation of water and nutrients: Practice and opportunity in southern US pine forests. Forest Ecology and Management 30:437-53.
AMERICAN FOREST & PAPER ASSOCIATION. 1995. 1995 statistics: Paper paperboard, & woodpulp. Washington, DC.
BURWELL, C.C. 1978. Solar biomass energy. An overview of US potential. Science 199:1041-48.
ENERGY INFORMATION ADMINISTRATION, 1994. Manufacturing consumption of energy. US Department of Energy Report DOE/EIA-0512(91). Washington, DC: US Government Printing Office.
ENVIRONMENTAL DEFENSE FUND ET AL. 1995. Economic considerations in forest management. White Paper No. 11. Washington, DC: Environmental Defense Fund.
GRIER, C.C., K.M. LEE, N.M. NADAKARNI, G.O. KLOCK, and P.J. EDGERTON. 1989. Productivity of forests of the United States and its relation to soil and site factors and management practices: A review. USDA Forest Service Report PNW-GTR-222.
HAYNES, R.W. 1990. An analysis of the timber situation in the United States: 1989–2040. USDA Forest Service General Technical Report RM-GTR-199.
HAYNES, R.W, D.M. ADAMS, and J.R. MILLS. 1995. The 1993 RPA timber assessment update. USDA Forest Service Report RM-GTR-259.
HYDE, WE 1997. Policies today and for the future. In Wood in our future. Washington, DC: National Academy Press and National Research Council.
INCE, P.J. 1994. Recycling of wood and paper products in the United States. Madison, WI: USDA Forest Products Laboratory.
KAFUS INDUSTRIES. 1999. Kafus options 147,000 acres in Arizona as proposed site for increased kenaf fibre production. News release. Available online at www. Kafus.com/pr/news.html.
MOULTON, R.J., F. LOCKHART, and J.D. SNELLGROVE. 1996. Tree planting in the United States 1995. Washington, DC: USDA Forest Service.
OHMANN, L.E 1984. Biomass in conifer plantations of northeastern Minnesota, USDA Forest Service Research Paper NC-247.
POWELL, D.S., J.L. FAULKNER, D.R. DARR, Z. ZHU, and D.W. MacCLEERY. 1993. Forest resources of the United States, 1992. USDA Forest Service Report RM-GTR234.
SMITH, W.B., J.L FAULKNER, and D.S. POWELL. 1994. Forest statistics of the United States, 1992. USDA Forest Service Report GTR-NC-168.
US BUREAU OF THE CENSUS. 1975. Historical statistics the United States, colonial times to 1970. Washington, DC: US Government Printing Office.
—–.1996. Statistical abstract of the United States. 116th ed. Washington, DC: US Government Printing Office.
US DEPARTMENT OF AGRICULTURE (USDA). 1993. Agricultural statistics 1993. Washington, DC: US Government Printing Office.
WAGGONER, PE., J.H. AUSUBEL, and I.K. WERNICK. 1996. Lightening the tread of population on the land: American examples. Population Development and Review 22(3):53145.
WERNICK, I.K., RE. WAGGONER, and J.H. AUSUBEL. 1998. Searching for leverage to conserve forests: The industrial ecology of wood products in the US Journal of Industrial Ecology 1(3):125-45.
Iddo K Wernick (e-mail: iw4@columbia.edu) is associate research scientist, Earth Institute, Columbia University New York, NY 10027; Paul E. Waggoner is scientist, Connecticut Agricultural Experiment Station, New Haven; and Jesse H. Ausubel is director, Program for the Human Environment, Rockefeller University, New York. A more detailed analysis, on which this article is based, is available online at https://phe.rockefeller.edu/forests.