Citation: The Bridge 29 (3): 4–16 1999
Keywords: Research, funding, zepp, wood products, natural gas
Areas of Research: The Scientific Enterprise, Technology & Human Environment
I envision a large, prosperous economy that treads lightly and emits little or nothing.
The first decade of my career I carried briefcases for William A. Nierenberg (NAE), Robert M. White (NAE), and other leaders in formulating such major research programs as the World Climate Program and the International Geosphere-Biosphere Program. An obscure fact is that in 1983 I was the scribe of Toward an International Geosphere-Biosphere Program: A Study of Global Change, the National Research Council (NRC) report that articulated and named the Global Change venture, one of the largest environmental programs of recent times. Working for the National Academies of Sciences and Engineering, I saw major efforts conceived, including the Human Genome Project, International Decade of Natural Disaster Reduction, and Superconducting SuperCollider. I learned what grand programs can and cannot do, how they are born, and what they cost. I learned that the sealing wax and string, the technical means to do research, open the new niches that we successfully explore.
Spurred by an invitation from the San Diego Science & Technology Council and hoping to rally my colleagues to glory on Earth, I here tell my top five Worthy Ways to spend large amounts of money for research on environment and resources. My top five span the oceans, land, human health, energy, and transport. All demand teams of engineers and scientists. Let’s
- count all the fish in the sea;
- verify that the extension of humans into the landscape has begun a Great Reversal and anticipate its extent and implications during the next century;
- assess national exposure of humans to bad things in the environment;
- build 5-gigawatt zero-emission power plants the size of an automobile; and
- get magnetically-levitated trains (Maglevs) shooting through evacuated tubes.
These Worthy Ways cohere in the vision of a large, prosperous economy that treads lightly and emits little or nothing.
1. Marine Census
In December 1998 for a week I sailed above the Arctic Circle in the Norwegian Sea, precisely counting herring in the dark. Over the decades of the Cold War, Norwegians honed their submarine acoustics, listening for Soviet vessels motoring out of Murmansk. This technology, integrated with others, makes possible the first-ever reliable worldwide Census of Marine Life. I prefer to say Census of the Fishes, conjuring beautiful images to Everyman. But, humanity needs to understand the diversity, distribution, and abundance of squids, jellies, and turtles, too, and so, deferring to accurate colleagues, I call this first Worthy Way the Census of Marine Life. But let me make the case primarily for fishes.
Many of the world’s leading icthyologists gathered at Scripps Institution of Oceanography in La Jolla, California, in March 1997 to consider what is known and knowable about the diversity of marine fishes.[1] The meeting attendees reported how many species are known in each region of the world’s oceans and debated how many might remain undiscovered. Known marine species total about 15,000. The meeting concluded that about 5,000 yet remain undiscovered. I find this prospect of discovering 5,000 fishes a siren call, a call to voyages of discovery in little explored regions of the Indian Ocean, along the deeper reaches of reefs, and in the mid-waters and great depths of the open oceans. The adventures of discovery of Cook, Darwin, and the explorers of Linnaeus’s century are open to our generation, too.
The urgency to cope with changes in abundance of fish amplifies the adventure of discovery. In August 1998 at the Oceanographic Institution in Woods Hole we advanced the concept of the Census at a workshop on the history of fished populations, some 100-200 of the 15-20 thousand species. From history, the assembled experts estimated that fish biomass in intensively exploited fisheries is about 1/10th the level pre-exploitation.[2] That is, the fish in seas where commercial fisherman do their best (or worst) to make a living now weigh only 10% of the fish they sought in those seas a few decades or hundred years ago.
Diverse observations support this estimate. For example, the diaries of early European settlers describe marvelous fish sizes and abundance off New England in the 1600s. From Scotland to Japan, commercial records document enormous catches with simple equipment during many centuries. Even now, when fishers discover and begin fishing new places, they record easy and abundant catches, for example, of orange roughy on Pacific sea mounts. Also scientific surveys of fish stocks indicate fewer and fewer spawning fish, mothers, compared to recruits, their offspring. The ratio of spawners to recruits has fallen to 20% and even 5% of its level when surveys began. A great marine mystery is what has happened to the energy in the ecosystem formerly embodied in the commercial fish.
The two dramatic numbers of the “missing,” the 5000 undiscovered fishes and the lost 90% of stocks, suggest the value of a much better and continuing description of life in the oceans. So, I propose a worldwide Census. The Census would describe and explain the diversity, distribution, and abundance of marine life, especially the upper trophic levels. Preoccupied by possible climatic change and the reservoirs of carbon that influence it, we have tended to assess life in the oceans in gigatons of carbon, neglecting whether the gigatons are in plankton, anchovies, or swordfish. I care what forms the carbon takes.
Three questions encapsulate the purpose of the Census. What did live in the oceans? What does live in the oceans? What will live in the oceans? The three questions mean the program would have three components. The first, probably not large or expensive, would be paleo and reconstruct the history of marine animal populations since human predation became important, say, the past 500 years.
The second and expensive part of the program would answer “What does live in the oceans?” and be observations lasting a few years, perhaps around the year 2005. We would observe the many parts of the oceans where we have so far barely glimpsed the biology, for example, the open oceans and mid-waters, together with strengthening efforts by national fisheries agencies that struggle with meager funds, personnel, and equipment to examine areas near shore where many species of commercial import concentrate.
As a maximalist, I hope to see integration and synchronization of technologies, platforms, and approaches. Acoustics are paramount, because every fish is a submarine, and acousticians can now interpret tiny noises 100 kilometers away. Optics also can detect much. For example, airborne lidars now range far, fast, and perhaps as deep as 50 meters. Lidars can also detect inexpensively if their planes are drones. And least expensive of all, smart and hungry, animals are themselves motivated samplers of their environments, and we know what they sampled if we tag them. The benefits of the technologies soar, if integrated. For example, acoustics, optics, and molecular and chemical methods can combine to identify species reliably from afar.
Answeringthe third question, “What will live in the oceans?” requires the integration and formalization that we call models. So, the Census would also have a component to advance marine ecosystem and other models to use the new data to explain and predict changes in populations and relations among them.
A major outcome of the Census would be an on-line three-dimensional geographical information system which would enable researchers or resource managers anywhere to click on a volume of water and bring up data on living marine resources reported in that area. Additionally, the observational system put in place for scientific purposes could serve as the prototype for a continuing diagnostic system observing living marine resources. A proper worldwide Census might cost a total of $1 billion over ten years. Costly, complicated observational programs prudently begin with pilot projects, to test both techniques and political will.
Not only technology and stressed fisheries but also an international treaty to protect biodiversity make the time ripe for this Worthy Way. Biodiversity now finds itself with many signatories to its Convention, but uncharted national obligations and resources. Acousticians, marine engineers, marine ecologists, taxonomists, statisticians, and others should join their talents to make the Census of Marine Life happen. In fact, some of us, supported by the Alfred P. Sloan Foundation, are trying.[3]
2. The Great Reversal
Humanity’s primitive hunting of the oceans has damaged marine habitats and populations. Fortunately on the land where humanity stands, engineering and science have infused farming and logging, so initiating the Great Reversal. The Great Reversal refers to human contraction in Nature, after millennia of extension. My measure is area, square kilometers or hectares. Simple area is the best single measure of human disturbance of environment.[4]
People transform land by building, logging, and farming.[5] First, let me speak briefly about the spread of the built environment, of “cities” broadly speaking. This includes land not only for roads, shopping centers, and dwellings, but also for lawns, town gardens, and parks. In the USA the covered land per capita ranges from about 2,000 m2 in states where travel is fast, like Nebraska, to less than a third as much in slower, more urban New York. The 30 million Californians, who epitomize sprawl, in fact average 628m2 of developed land each, about the same as New Yorkers.
The transport system and the number of people basically determine covered land. Greater wealth enables people to buy higher speed, and when transit quickens, cities spread. Average wealth and numbers will grow. So, cities will take more land.
What are the areas of land that may be built upon? The USA is a country with fast growing population, expecting about another 100 million people over the next 75 years, when the world is likely to have about 10 billion. At the New York and California rate of 600m2 each, the USA increase would consume only 6 million hectares, about the area of West Virginia or 15% of California. Globally, if everyone builds at the present California rate, 4 billion more people would cover about 240 million hectares, midway in size between Mexico and Argentina, 6 to7 Californias.
By enduring crowding, urbanites spare land for nature. Enduring more crowding, they could spare more. Still, cities will take more land. Can changes in logging and farming offset the urban sprawl?
Forests are cut to clear land for farms and settlements and also for fuel,
lumber, and pulp.[6] In America, from the time of European settlement until 1900 we chopped fervidly and made Paul Bunyan a hero. In the 20th century, however, America’s forested area has remained level, and since 1950 the volume of wood on American timberland has grown 30%. In the same interval, European forests have increased about 25% in volume. In the USA, the intensity of use of wood defined as the wood product consumed per dollar of GDP has declined about 2.5% annually since 1900. In 1998 an average American consumed half the timber for all uses as a counterpart in 1900.
In the USA, likely continuing fall in intensity of use of forest products should more than counter the effects of growing population and affluence, leading to an average annual decline of perhaps 0.5% in the amount of timber harvested for products. A conservative 1.0% annual improvement in forest growth would compound the benefits of steady or falling demand and could shrink the area affected by logging 1.5% annually. Compounded, the 1.5% would shrink the extent of logging by half in 50 years. If one half of this amount occurs by leaving areas now cut uncut, the area spared is 50 million hectares, 1/3rd more than the area of California. Changing technology, taste, and economics create similar timberland patterns in numerous countries. Since 1990 forests have increased in 44 of 46 temperate countries, excepting the Czech Republic and Azerbaijan.
Rising productivity of well-managed forests should comfortably allow 20% or less of today’s forest area of about 3 billion hectares to supply world commercial wood demand in the middle of the 21st century.[7] Unmanaged forests now yield yearly an average of 1-2 cubic meters (m3) of commercially valuable species per hectare. Potential in secondary temperate forests ranges between 5 and 10 m3. Many commercial plantation forests now reliably produce more than 20 m3 year, and experimental plots have yielded over 60 m3.
In poor regions of tropical countries such as Brazil, Indonesia, and Congo, the dominant force stressing forests remains the struggle to subsist. During the last couple of decades, the removal of tropical forests has been estimated at 1% per year. Until overcome by better livelihoods, cheap land, cheaper fuels, superior alternatives to wood in the marketplace, or taboos the one-time conversion of forests to money, cropland or fuel will continue. Nevertheless, global expansion of forests and rising incomes encourage. Indeed, about 165 million hectares once used for crops and pasture have reverted to secondary forest in Latin America alone, an area more than ¾ the size of Mexico, 4 Californias or 1 Alaska.[8]
This brings us to farms. For centuries, farmers expanded cropland faster than population grew, and thus cropland per person rose. Fifty years ago, farmers stopped plowing up more nature per capita, initiating the Great Reversal (Figure 1). Meanwhile, growth in calories in the world’s food supply has continued to outpace population, especially in poor countries. Per hectare, farmers have lifted world grain yields about 2 percent annually since 1960.
Frontiers for agricultural improvement remain wide open, as average practice moves steadily toward the present yield ceiling and the ceiling itself keeps rising. On the same area, the average world farmer consistently grows about 20% of the corn of the top Iowa farmer, and the average Iowa farmer advances in tandem about 30 years behind the yields of his or her most productive neighbor. While an average Iowa corn farmer now grows 8 tons per hectare, top producers grow more than 20 tons compared with a world average for all crops of about 2. On one hectare the most productive farmers now make the calories for a year for 80 people when their grandparents struggled to make the calories for 3.
High and rising yields are today the fruit of precision agriculture. Technology and information help the grower use precise amounts of inputs-fertilizer, pesticides, seed, water-exactly where and when they are needed. Precision agriculture includes grid soil sampling, field mapping, variable rate application, and yield monitoring-tied to global positioning. Precision agriculture is frugal with inputs, like other forms of lean production that now lead world manufacturing.
If during the next 60 to 70 years, the world farmer reaches the average yield of today’s USA corn grower (less than 40% of today’s ceiling), ten billion people eating on average as people now do will need only half of today’s cropland. The land spared exceeds the Amazonia. This sparing will happen if farmers maintain the yearly 2% worldwide growth of grains achieved since 1960. In other words, if innovation and diffusion continue as usual, feeding people will not stress habitat for Nature. Even if the rate of improvement falls to half, an area the size of India, globally, will revert from agriculture to woodland or other uses. A meaty USA diet of 6,000 primary calories/day doubles the difficulty or halves the land spared.
In summary, globally, if an additional 4 billion people pave and otherwise develop land at the present rate of Californians, cities will consume about 240 million hectares. This area appears likely to be offset by land spared from logging in the USA and other countries that now reduce their cutting of forests. The likely added land spared from crops globally over the time it takes to reach 10 billion people suggests a net worldwide return to Nature of lands equal to India or more than 6 Californias.
On land as in the oceans, anecdotes, affection for Nature, and the plight of the poor farmer and logger will impel nations to spend and prohibit. The goal of my second Worthy Way, verifying and forecasting the probable extent of the Great Reversal, is first guiding and then strengthening the actions so they will produce the hoped for conservation and restoration unalloyed by the disillusionment of failure. The distribution of lands spared will greatly affect the chances recreated for flora and fauna.
The research for the Great Reversal includes observations as well as experiments and analyses. In many parts of the world routine aerial surveying of land use confirmed by ground measurements remains far from complete or usefully periodic. Geographers, foresters, agronomists, ecologists, agricultural and civil engineers, and technologists need to agree on definitions, protocols, and priorities for building the world land information system. The long-term behavior and potential of intensively managed forests exemplify the need for experiment and analysis.
International frameworks for studying the Great Reversal exist in the Global Change program and in joint efforts of the World Bank and World Wildlife Fund for forest conservation. These programs hunger for a feasible, attractive technical vision. Excluding costs for satellites, which I believe have anyway already contributed the answers they are likely to contribute to this question, my guess is that for about $100 million we could verify the Great Reversal and forecast its probable extent. The information would chart a new sound and grand strategy for conserving the landscape and the other animals with which we share it.
3. Human Exposure Assessment
My first two Ways to spend have been Worthy because they would deepen our understanding of sea and land and create the context for protecting other life while we feed ourselves. My third Worthy Way to spendconcerns what we humans absorb from the environment. Recall our high fears and outlays for ionizing radiation, pesticides, and asbestos.
Like other animals, we take in water, food, air, and dust. Given our genes, we are what we eat in the broadest sense. Yet, little research chronicles actual human exposures. Exposure estimates often trace back to very indirect measures, such as chimney emissions. And our habits and habitats seem overlooked. Consider where Americans spend 24 hours (Figure 2). One wonders why so much exposure measurement and regulation have concentrated on traffic intersections when we are usually home sleeping. Moreover, exposures even to a single chemical may occur from contact with several media (air, water), via several pathways (hand-to-mouth transfers, food), and through several routes (inhalation, oral, dermal).
To gather information about the magnitude, extent, and causes of human exposures to specific pollutants and measure the total “dose” of selected pollutants that Americans receive, in 1994 the Environmental Protection Agency (EPA) launched a National Human Exposure Assessment Survey (NHEXAS).[9] Its ultimate goal is documenting the status and trends of national exposure to risky chemicals both to improve risk assessments and to evaluate whether risk management helps.
For pilot studies, EPA chose metals, volatile organic compounds, and pesticides and polynuclear aromatics, because of their toxicity, prevalence in the environment, and relative risk to humans—at least as EPA and perhaps the public believe. I never forget Bruce Ames’ work showing that 99.99% of the pesticides we ingest are natural.[10] In any case, EPA’s chosen classes of compounds and the expected combination of chemicals, exposure media, and routes of exposure would demonstrate and challenge currently available analytical techniques.
Phase I, demonstration and scoping projects, may already be the most ambitious study of total human exposure to multiple chemicals on a community and regional scale. It has focused on exposure of people to environmental pollutants during their daily lives. Survey participants wore “personal exposure monitors” to sample their microenvironments. Meanwhile, NHEXAS researchers measured levels of chemicals to which participants were exposed in their air, foods, water and other beverages, and in the soil and dust around their homes. They also measured chemicals or their metabolites in blood and urine provided by participants. Finally, participants completed time-activity questionnaires and food diaries to help identify sources of exposure to chemicals and to characterize major activity patterns and conditions of the home environment. Several hundred Arizonans, several hundred Midwesterners, and 60 Marylanders participated. Sample collection began in 1995 and went to early 1998. Publications are expected soon and databases in 2000.
The main purpose of the pilot study is to find the best way to conduct the full national human exposure assessment survey. Implementing representative monitoring projects to estimate the magnitude, duration, frequency, and the spatial and temporal distribution of human exposures for the USA will be a large task, involving chemists, biologists, statisticians, and survey researchers. I hope clever engineers can lighten, integrate, and automate the measurement and speed reporting.
I learned of NHEXAS while serving for three years on the executive committee of EPA’s Science Advisory Board. NHEXAS was an unpolished diamond in a lackluster research portfolio. Neither EPA’s leadership nor the Congress appreciated the Survey, so it has proceeded slowly and barely. I guess the cost to perform NHEXAS right might be $200 million over 6-7 years. I believe the USA should make a strong commitment to it, though not exactly as underway. It needs a less “toxic” bias. A national scientific conference to adjust and advance the concept might be timely.
The eventual outcomes of NHEXAS should include a comprehensive total human exposure database and models that accurately estimate and predict human exposures to environmental chemicals for both single and multiple pathways. The models would link environmental and biological data with information on human activity to estimate total human exposures to various chemicals and combinations and thus contribute to better risk assessments. We can establish proper baselines of normal range of exposure and identify groups likely to be more exposed.
We know surprisingly little about our exposures. For decades researchers have measured and tracked pollutants one at a time, often faddishly. This third Worthy Way can reduce the uncertainty about exposure and indeed make exposure a science. Understanding aggregate exposures, we may find surprisingly powerful levers to reduce ambient bads or increase goods.
4. ZEPPs
One way to finesse the question of exposure, whether for humans or green nature, is with industries that generate zero emissions. A growing gang of us has been promoting the concept of industrial ecology, in which waste tends toward zero, either because materials that would become waste never enter the system, or because one manufacturer’s wastes become food for another in a nutritious industrial food chain, or because the wastes are harmless. For this human, yours truly, I certainly want zero emissions of poisonous elements such as lead and cadmium.
For green nature exposed outdoors, however, the giga-emission is carbon, and I shall exemplify zero emission by tackling the giga-emission with my fourth Worthy Way to spend.
Today industries annually emit about 6 gigatons of carbon to the atmosphere, or a ton per each of the planet’s 6 billion people. The mounting worry is that these and more gigatons likely to be emitted will make a punishing climate for nature exposed outdoors.
Most of the carbon comes, of course, from fuel to energize our economies, and an increasing portion of the energy is in the form of electricity. Since Thomas Edison, the primary energy converted to electricity has grown in two sequential, long S-curves until it is now about 40% of all energy humanity uses. Although electric consumption leveled until recently at the top of its second S-curve, I believe it will maintain an average 2-3% annual growth through the 21st century. In the information era, consumers will surely convert even more of their primary energy to electricity. And, after all, two billion people still have no electricity. A hundred years at 2-3% growth per year would raise the world average per capita electricity consumption of 10 billion or so in the year 2100 only to today’s average USA per capita consumption.
Remembering that my fourth Worthy Way was to eliminate carbon emission, I ask what fuel generates the electricity. The evolving shares of primary energy sources, with more hydrogen per carbon atom, gradually and desirablydecarbonize the energy system from wood and hay to coal to oil to natural gas.[11] Nuclear, probably, or possibly some other non-carbon alternative will eventually close the hydrocarbon fuel era. In the interim, however, can we find technology consistent with the evolution of the energy system to economically and conveniently dispose the carbon from making kilowatts? This is my fourth Worthy Way: Finding a practical means to dispose the carbon from generating electricity consistent with the future context. The Way is what I and my associates call ZEPPs, Zero Emission Power Plants.
The first step on the road to ZEPPs is focusing on natural gas simply because it will be the dominant fuel, providing perhaps 70% of primary energy around the year 2030.[12] Although natural gas is far leaner in carbon than other fossil fuels, when natural gas does provide 70% of primary energy, CO2 emission from it will be about 75% of total CO2 emissions.
A criterion for ZEPPs is working on a big scale. A peak use of, say, 30 x 1012 m3 of natural gas in 2060, corresponds to 2 to 3 times today’s carbon emission to dispose annually. Even in 2020, we could already need to dispose carbon from gas alone equal to half today’s emission from all fuel.
Big total use means big individual ZEPPs because the size of generating plants grows even faster than use. Although the last wave of power station construction reached about 1.5 gigawatts (GW), growth of electricity use for the next 50 years can reasonably raise plant size to about 5 GW (Figure 3). For reference, the New York metropolitan area now draws above 12 GW on a peak summer day.
Plants grow because large is cheap if technology can cope. Crucial for controlling emission, one big plant emits no more than many small plants but emission from one is easier to collect. We cannot solve the carbon question if we need to collect emissions from millions of microturbines.
So far, I’ve specified my way to spend as a search for big ZEPPs fueled by natural gas. But bigger ZEPPs mean transmitting immense power from larger and larger generators through a large steel axis at a speed such as 3,000 revolutions per minute (RPM).
The way around the limits of mechanical power transmission may be shrinking the machinery. Begin with a very high pressure CO2 gas turbine where fuel burns with oxygen. Needed pressure ranges from 40 to 1000 Atm, where CO2 would be recirculated as a liquid. The liquid combustion products would be bled out.
Fortunately for transmitting power, the very high pressures shrink the machinery in a revolutionary way and permit very fast RPMs for the turbine. The generator could then also turn very fast, operating at high frequency, with appropriate power electronics to slow the output to 50 or 60 cycles. People have seen the attraction of higher RPMs for a while. High RPM generators are included in the last version of a gas turbine of the High Temperature Reactor of the General Atomics corporation.
Materials issues lurk and solutions are expensive to test. The envisioned hot temperature of 1500 degrees is what challenges engineers in aviation. Fortunately, Japanese have recently reported a tough, thermally conductive ceramic strong up to 1600o in air.[13] Problems of stress corrosion and cracking will arise.
Although combustion within CO2 does not appear a general problem, some may arise at the high temperatures and pressures. Also no one has yet made burners for such high pressures as we consider. Power electronics to slow the cycles of the alternating current raises big questions. So far, the cost of power electronics exceeds benefit. The largest systems for conversion between alternating and direct current are now 1.5 GW and can handle 50-60 cycles. Conversion costs are about $100 per kilowatt (kW), a big increment to the present $200 per kW for a simple turbine and $300-$400 for a combined cycle generator. Present limits of about 100 hertz are not fast enough to convert 30,000 RPMs to 3,600 RPM. What we envision is beyond the state of the art, but power electronics is still young, meaning expensive and unreliable, and we are thinking of the year 2020 and beyond when this Worthy Way could make it mature, cheap and reliable. Already engineers consider post-silicon power electronics with diamond plasma switches.
The requisite oxygen for the ZEPP, say, 1,000 tons/hr for a 5 GW plant, also exceeds present capacity, about 250 tons/hr by cryoseparation, but could be done. Moreover, the cryogenic plant may introduce a further benefit. The power equipment suppliers tend to think of very large and slow rotating machines for high unit power. The core of the problem is in mechanical resistance of materials. Here we might recur to superconductors that are more “in” with a cryogenic plant nearby.
With a ZEPP fueled by natural gas transmitting immense power at 60 cycles, the next step is sequestering the waste carbon. Because of the high pressure, the waste carbon is, of course, already easily-handled liquid carbon dioxide. In principle aquifers can store CO2 forever if their primary rocks are silicates, which with CO2 become stable carbonates and silica (SiO2). The process is the same as rocks weathering in air. The Dutch and Norwegians have done a lot on CO2 injection in aquifers, and the Norwegians have already started injecting.
Opportunity for storing CO2 will join access to customers and fuel in determining plant locations. Fortunately, access to fuel may become less restrictive. Most natural gas travels far through a few large pipelines, which makes these pipelines the logical sites for generators. The expanding demand will require a larger and wider network of pipelines, opening more sites for ZEPPs.
Another criterion is overall projected plant efficiency. Colleagues at Tokyo Electric Power calculate the efficiency of the envisioned ZEPP could be 70%.
In short, the fourth Worthy Way is a supercompact (1-2 m diameter), superpowerful (potentially 10 GW or double the expected maximum demand), superfast (30,000 RPM) turbine putting out electricity at 60 cycles plus CO2 that can be sequestered. ZEPPs the size of an automobile, attached to gas pipelines, might replace the fleet of carbon emitting non-nuclear monsters now cluttering our landscape.
We propose starting introduction of ZEPPS in 2020, leading to a fleet of 500 5 GW ZEPPs by 2050. This does not seem an impossible feat for a world that built today’s worldwide fleet of some 430 nuclear power plants in about 30 years. Combined with the oceans safely absorbing 2-3 Gt C yearly, ZEPPs, together with another generation of nuclear power plants in various configurations, can stop CO2 increase in the atmosphere near 2050 AD and 450-500 ppm without sacrificing energy consumption.
Research on ZEPPs could occupy legions of academic researchers, and restore an authentic mission to the DOE’s National Laboratories, working on development in conjunction with companies such as General Electric, Air Products, and General Atomics. The fourth Worthy Way to spend merits tens of billions in R&D, because the plants will form a profitable industry worth much more to those who can capture the expertise to design, build, and operate ZEPPs. Like all my Worthy Ways, ZEPPs need champions.
To summarize, we have searched for technologies that handle the separation and sequestration of amounts of carbon matching future fuel use. Like the 747 jumbojets that carry about 80% of passenger kilometers, compact ultrapowerful ZEPPs could be the workhorses of the energy system in the middle of the next century.
5. Maglevs
Cutting emissions and the footprints of farming, logging, and power, we naturally also wonder about transport. Transport now covers Earth with asphalt ribbons and roars through the air leaving contrails that could prove harmful. With cars shifting to fuel cells fed with hydrogen over the next few decades, the air transport system and its jet fuel can become emissive enemy #1. Fortunately the time is right for innovation in mobility, my fifth Worthy Way.
Since 1880, including walking, USA per capita mobility has increased 2.7%/yr and the French about the same. Europeans currently travel at about 35 km per hour and per day, because people travel about 1 hour per day. Of this, Europeans fly only about 20 seconds or 3 km per day. A continuing rise in mobility of 2.7% per year means a doubling in 25 years, and an additional 35 km per day or about 3 minutes on a plane. Three minutes per day equal about one round-trip per month per passenger. Americans already fly 70 seconds daily, so 3 minutes certainly seems plausible for the average European a generation from now. The jetset in business and society already flies a yearly average of 30 minutes per day. However, for the European air system, the projected level requires a 14-fold increase in 25 years, or about 12% per year. The USA would need a 20-fold increase in 50 years. A single route that carries one million passengers per year per direction would require 60 take-offs and landings of jumbojets. The jumbos would need to take off like flocks of birds. Unlikely. We need a basic rethinking of planes and airport logistics.
The history of transport can be seen as a striving to bring extra speed to the progressively expanding level of income within the fixed amount of time we are willing to expose ourselves to travel.[14] According to a rhythmic historical pattern (Figure 4), a new, fast transport mode should enter about 2000. The steam locomotive went commercial in 1824, gasoline engine in 1886, and jet in 1941. In fact, in 1991, the German Railway Central Office gave the magnetic levitation (maglev) system a certificate of operational readiness and a Hamburg-Berlin line is now under construction.[15],[16] The essence of the maglev is that magnets lift the vehicle off the track, thus eliminating friction, and that activation of a linear sequence of magnets propels the vehicle.
Maglevs have many advantages: not only high mean speed but acceleration, precision of control, and absence of noise and vibration. They can be fully passive to forces generated by electrical equipment and need no engine on board. Maglevs also provide the great opportunity for electricity to penetrate transport, the end-use sector from which it has been most successfully excluded.
The induction motors that propel maglevs can produce speeds in excess of 800 km per hour and in low pressure tunnels thousands of km per hr. In fact, electromagnetic linear motors have the capacity to exert pull on a train independent of speed. A traditional electric or internal combustion engine cannot deliver power proportional to speed. In contrast, the new motors allow constant acceleration. Constant acceleration maglevs (CAMs) could accelerate for the first half of the ride and brake for the second and thus offer a very smooth ride with high accelerations.
High speed does entrain problems: aerodynamic and acoustic as well as energetic. In tunnels, high speed requires large cross sections. The neat solution is partially evacuated tubes, which must be straight to accommodate high speeds. Low pressure means a partial vacuum comparable to an altitude of 15 thousand meters. Reduced air pressure helps because above about 100 km per hour the main energy expense to propel a vehicle is air resistance. Low pressure directly reduces resistance and opens the door to high speed with limited energy consumption. Tunnels also solve the problem of landscape disturbance. CAMs operating in evacuated tubes are my fifth Worthy Way.
For a subsurface network of such maglevs, the cost of tunneling will dominate. The Swiss are actually considering a 700 km system.[17] For normal high-speed tunnels, the cross-section ratio of tunnel to train is about 10-1 to handle the shock wave. With a vacuum, however, even CAMs could operate in small tunnels, fitting the size of the train. In either case the high fixed cost of infrastructures will require the system to run where traffic is intense–or huge currents can be created, that is, trunk lines. Because the vehicles will be quite small, they would run very often. In principle, they could fly almost head-to-tail, ten seconds apart.
Initially, maglevs will likely serve groups of airports, a few hundred passengers at a time, every few minutes. They might become profitable at present air tariffs at 50,000 passengers per day. In essence maglevs will be the choice for future Metros, at several scales: urban, possibly suburban, intercity, and continental.
The vision is small vehicles, rushing from point to point. Think of the smart optimizing elevators in new skyscrapers. Alternately, the physical embodiment resembles, conceptually, that of particle accelerators, where “buckets” of potential fields carry bunches of charged particles. Maglevs may come to be seen as spin-offs of the physics of the 1970s and 1980s, as transistors are seen as realizations of the quantum mechanics of the 1920s and 1930s.
With maglevs, the issue is not the distance between stations, but waiting time and mode changes, which must be minimized. Stations need to be numerous and trips personalized, that is, zero stops or perhaps one.
Technically, among several competing designs the side-wall suspension system with null-flux centering, developed in the United States by the Foster-Miller company, seems especially attractive: simple, easy access for repair, and compact.[18] Critically, it allows vertical displacement and therefore switches with no moving parts. Vertical displacement can be precious for stations, where trains would pop up and line up, without pushing other trains around. It also permits a single network, with trains crossing above or below. Alternatively, a hub-and-spoke system might work. This design favors straight tubes and one change.
The suspension system evokes a comparison with air. Magnetic forces achieve low-cost hovering. Planes propel by pushing air back. Momentum corresponds to the speed of the air pushed back, that is, energy lost. Maglevs do not push air back, but in a sense push Earth, a large mass, which can provide momentum at negligible energy cost. The use of magnetic forces for both suspension and propulsion appears to create great potential for low travel-energy cost, conceptually reduced by 1-2 orders of magnitude with respect to energy consumption by airplanes with similar performance.
Because maglevs carry neither engines nor fuel, the weight of the vehicle can be light and total payload mass high. Airplanes at takeoff, cars, and trains all now weigh about 1 ton per passenger transported. A horse was not much lighter. Thus, the cost of transport has mainly owed to the vehicle itself. Maglevs might be 200 kg per passenger.
At intercity and continental scale, maglevs could provide supersonic speeds where supersonic planes cannot fly. For example, a maglev could fuse all of mountainous Switzerland into one functional city in ways that planes never could, with 10 minute travel times between major present city pairs.
Traveling in a CAM for 20 minutes, enjoying the gravitational pull of a sports car, a woman in Miami could go to work in Boston and return to cook dinner for her children in the evening. Bostonians could symmetrically savor Florida, daily. Marrakech and Paris would work, too. With appropriate interfaces, the new trains could carry hundreds of thousands of people per day, saving cultural roots without impeding work and business in the most suitable places.
Seismic activity could be a catch. In areas of high seismic activity, such as California, safe tubes (like highways) might not be a simple matter to design and operate.
Although other catches surely will appear, maglevs should displace the competition. Intrinsically, in the CAM format they have higher speed and lower energy costs and could accommodate density much greater than air. They could open new passenger flows on a grand scale during the 21st century with zero emissions and minimal surface structures.
We need to prepare a transport system that can handle huge fluxes of traffic. A 2.7% per year growth in passenger kilometers traveled means not only doubling of mobility in 25 years but 16 times in a century, which is the rational time for conceiving a transport system. The infrastructures last for centuries. They take 50-100 years to build, in part because they also require complementary infrastructures. Moreover, the new systems take 100 years to penetrate fully at the level of the consumer. Railroads began in the 1820s and peaked with consumers in the 1920s.
It is time for my fifth Worthy Way, to conceive in detail maglevs for America. And to develop the required skills, such as tunnelling. Universities should be producing the needed engineers, operations researchers, and physicists, and government should partner with industry on the prototypes.
Like ZEPPs, maglevs will bring huge revenues to those who can design, build, and operate them, anywhere in the world.
Closing Remarks
A worldwide Census of Marine Life can reawaken the adventure of the Age of Discovery and teach us how to spare marine habitats. A study of the Great Reversal of human extension into the landscape can inspire us to lift yields and spare land for Nature. The National Human Exposure Assessment Survey can show what we absorb and how to spare exposures. ZEPPs can generate many gigawatts without harmful emissions, sparing the climate. And maglevs can multiply our mobility while sparing air and land. These Worthy Ways to spend on environment and resources cohere in the vision of a large prosperous human economy that treads lightly and emits little or nothing.
Research is a vision or dream in which we, like Leonardo da Vinci, simulate a machine first in our mind. Leonardo’s powers of visualization, one might say experiment, were so great, that the machines work, even if the letting of contracts and construction is delayed 500 years. Building machines is often costly. Dreaming is cheap. Let us start now with these Five Worthy Ways to Spend that can make dreams of improving the human condition and environment so irresistibly beautiful and true that societies, especially America, hasten to let the contracts and build the machines that can spare planet Earth–soon instead of after a delay of 500 years.
Acknowledgements: This essay was initially prepared as an address to the San Diego Science & Technology Council, La Jolla, California, 9 December 1998. Thanks to Edward Frieman and William A. Nierenberg (NAE) for hosting the visit. I am grateful to Cesare Marchetti, Perrin Meyer, and Paul Waggoner for helping develop these Worthy Ways over many years.
Figure Captions
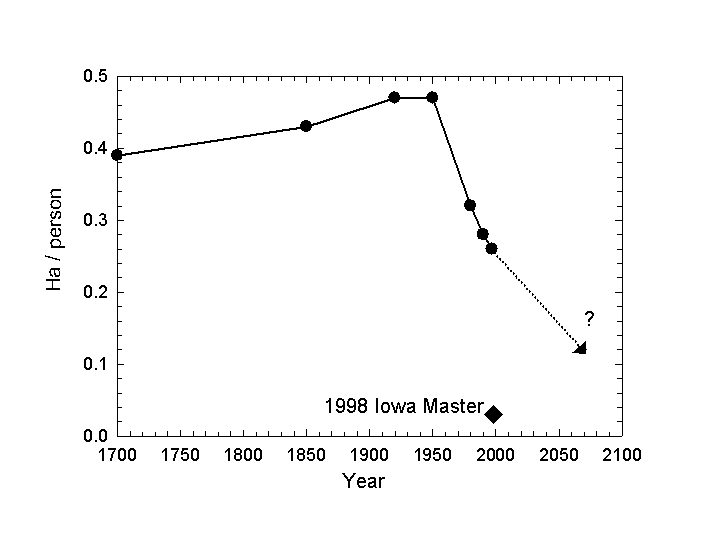
Figure 1. The Great Reversal. After gradually increasing for centuries, the worldwide area of cropland per person began dropping steeply in about 1950, when yields per hectare began to climb. The diamond shows the area needed by the Iowa Master Corn Grower of 1998 to supply one person a year’s worth of calories. The dotted line shows how sustaining the lifting of average yields 2%/yr extends the Reversal. Sources of data: FAO Yearbooks, Food and Agriculture Organization of the United Nations, various years; Wallace’s Farmer, March 1999; J. F. Richards, “Land Transformation,” in The Earth as Transformed by Human Action, B. L. Turner et al., eds., Cambridge University, Cambridge, England, 1990.
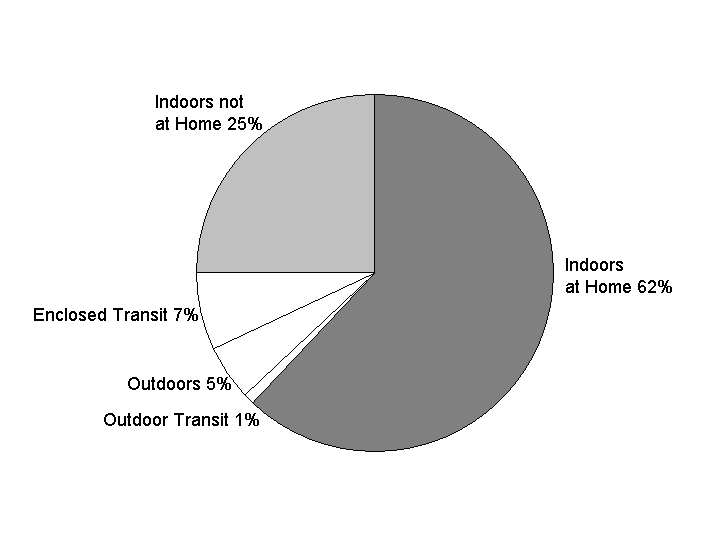
Figure 2. Percentage of time spent in major locations by Californians. Source: J. A. Wiley, J. P. Robinson, T. Piazza, K. Garrett, K. Cirksena, Y. T. Cheng, and G. Martin, Activity Patterns of California Residents, California Survey Research Center, U. of California, Berkeley, 1991.
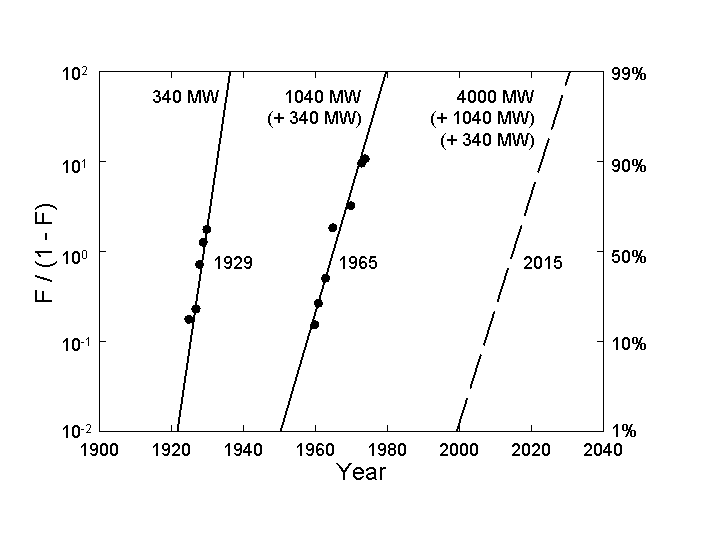
Figure 3. The maximum size of power plants, USA. Each line represents an S-shaped (logistic) curve normalized to 100 percent, with estimates for the midpoint of the process and saturation level indicated. So, the pulse centered in 1929 quickly expanded power plants from a few tens of megawatts (MW) to about 340. After a period in which plant size stagnated, the pulse centered in 1965 quadrupled maximum plant size to almost 1400 MW. The patterns for the world and a dozen other countries we have analyzed closely resemble the USA. We project another spurt in plant size centered around the year 2015, quadrupling the maximum again, to more than 5 GW. F is fraction of the process completed. Source of data: World Electric Power Data CDROM UDI-2454, Utility Data Institute, Washington DC, https://www.udidata.com/
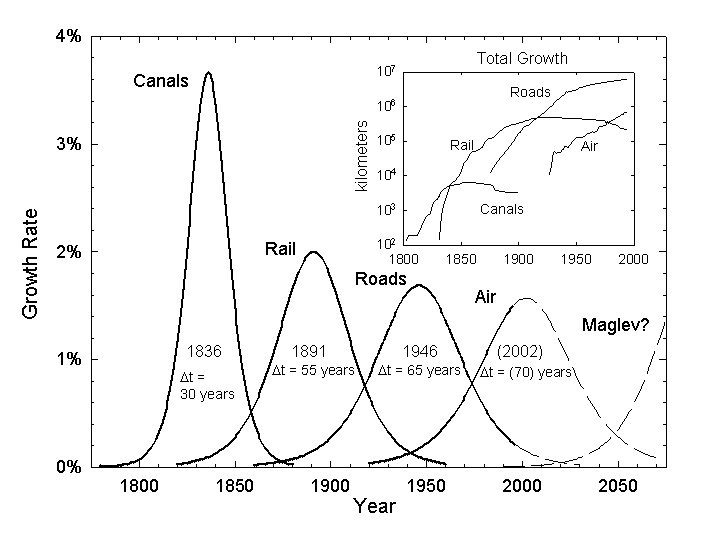
Figure 4. Smoothed historic rates of growth (solid lines) of the major components of the USA transport infrastructure and conjectures (dashed lines) based on constant dynamics. The years are the midpoints of the processes, and delta t is the time for the system to grow from 10% to 90% of its extent. The inset shows the actual growth, which eventually became negative for canals and rail as routes were closed. Source: Jesse H. Ausubel, C. Marchetti, and P.S. Meyer, Toward Green Mobility: The Evolution of Transport, European Review 6(2):137-156, 1998.
References
[1] William A. Nierenberg, The Diversity of Fishes: The Known and Unknown, Oceanography 12(3):6-7, 1999.
[2] John H. Steele and Mary Schumacher,On the History of Marine Fisheries, Oceanography 12(3):28-29, 1999.
[3] https://phe.rockefeller.edu/fish
[4] “Thus, in spite of all the interest in fragmented populations, the primary aim in conservation should be simply to preserve as much habitat as possible.” (p. 47) Ilkka Hanksi, Metapopulation Dynamics, Nature 396:41-49, 1998.
[5] Paul E. Waggoner, Jesse H. Ausubel, Iddo K. Wernick, Lightening the Tread of Population on the Land: American Examples, Population and Development Review 22(3):531-545, 1996.
[6] Iddo K. Wernick, Paul E. Waggoner, and Jesse H. Ausubel, Searching for Leverage to Conserve Forests: The Industrial Ecology of Wood Products in the U.S. , Journal of Industrial Ecology 1(3):125-145, 1997.
[7] Roger A. Sedjo and Daniel Botkin, Using Forest Plantations to Spare Natural Forests, Environment 39(10): 14-20 & 20 & 30, 1997.
[8] Joyotee Smith, Can Secondary Forests Mitigate Primary Forest Depletion? Implications from Small-Scale Farms in the Peruvian Amazon, International Center for Tropical Agriculture (e.smith@cgnet.com).
[9] Special Issue on NHEXAS, Journal of Exposure Analysis and Environmental Epidemiology 5(3): 1995.
[10] Ames, B.N., Profet, M. and Gold, L.S., Dietary Pesticides (99.99% All Natural). Proceedings National Academy of Sciences USA 87:7777-7781, 1990.
[11] Jesse H. Ausubel, Energy and Environment: The Light Path, Energy Systems and Policy 15:181-188, 1991.
[12] Jesse H. Ausubel, Arnulf Gruebler, and Nebojsa Nakicenovic, Carbon Dioxide Emissions in a Methane Economy, Climatic Change 12:245-263, 1988.
[13] Toshihiro Ishikawa et al., A Tough Thermally Conductive Silicon Carbide Composite with High Strength up to 1600o C in Air, Science 282: 1295, 1998.
[14] Jesse H. Ausubel, C. Marchetti, and P.S. Meyer, Toward Green Mobility: The Evolution of Transport, European Review 6(2):137-156, 1998.
[15] MVP (Versuchs- und Planungsgesellschaft für Magnetbahnsysteme m.b.H), Die offizielle Transrapid Homepage, URL https://www.mvp.de/, Munich, Germany, 1997.
[16] MIKA, J., Transrapid Informations Resourcen Homepage, URL https://transrapid.simplenet.com/, Germany, 1997.
[17] Jufer, M., Swissmetro: Wissenschaftliche Taetigkeit der ETH-Lausanne und Zuerich, Hauptstudie-Zwischenbericht Juli 1994-Juni 1996, ETH-Lausanne, Switzerland, 30 August 1996. URL https://sentenext1.epfl.ch/swissmetro.
[18] U.S. Department of Transportation, Compendium of Executive Summaries from the Maglev System Concept Definition Final Reports, DOT/FRA/NMI-93/02, pp. 49-81, March 1993. On-line at https://www.bts.gov/smart/cat/CES.html