The Barcode Blog

A mostly scientific blog about short DNA sequences for species identification and discovery. I encourage your commentary. -- Mark Stoeckle

Subscribe to this blog

Sign up for email notifications

Archive for September, 2006

Dueling taxonomists agree: DNA barcoding invaluable for species identification

Wednesday, September 27th, 2006

In October 2006 Conservation Biology, Rob DeSalle, American Museum of Natural History, comments on April 2006 CB piece on barcoding by Daniel Rubinoff, University of Hawaii (also see earlier Barcode Blog post on this article), and DeSalle’s commentary is followed by reply from Rubinoff. Such fun! DeSalle divides his analysis of DNA barcoding into its utility in “species identification” ie assigning specimens to known species, and “species discovery” ie formal descriptions of new species previously unknown to science. Both researchers cede the field of “species identification” to DNA barcoding (DeSalle: “a species identification system based on DNA sequences [would] be reliable, consistent, and rapid”; Rubinoff: “barcodes could be invaluable for speed and accuracy”).

Establishing reference libraries will be a major scientific achievement on the scale of the Human Genome Project. As these become available, the limiting factors for DNA barcoding will be cost and availability of sequence analysis, but as DeSalle observes, “it is not unreasonable to assume that DNA technology will advance to the stage where field-based diagnostics can be accomplished”.

Since there are about 1.1 million named multicellular animal species, “species identification” is a vast area for scientific research and practical application of DNA barcoding. It seems likely that the 1.1 million known species includes most of the more abundant and wide-ranging species, and most that are of direct economic or scientific importance to humans. It is generally believed there are many more undescribed species than what has already been named. These may be largely rarer species with limited distributions (see earlier post on “rare microbial biosphere“). Population sizes and ranges in the undescribed biosphere, together with measures of genetic diversity (see last week’s post) might be interesting research areas.

The rest of the exchange centers on the role of DNA barcoding in “species discovery” ie formal descriptions of species previously unknown to science. Here both turn cautious, reserving an essential role for expert judgement. (DeSalle: “DNA sequence information in the absence of other corroborating evidence can never be used by itself as an indicator of species delimitation”. Rubinoff: “my opposition is to the practice by which species are known and identifiable only through a DNA barcode”.)

It may be that it takes a taxonomist to recognize a new species and that it is essential to use an integrated approach combining morphology, ecology, together with DNA sequence data.  However, I am struck that in practice taxonomists often apply a “DNA-first” approach and that an untrained person could recognize most of the sequence clusters that correspond to species. A Google search with “new species” and “dna” turns up dozens of reports in which DNA sequence differences are the first and strongest evidence for cryptic species, including the 2 new shark species shown below.
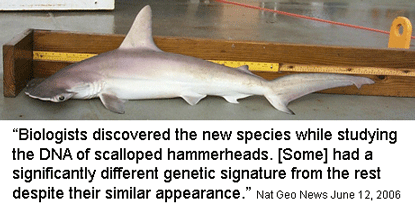
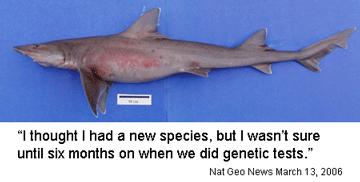


It is surprising that the published description of the new shark species shown above did not include any DNA sequence data! 

I close with a question about distance vs character comparisons of sequence data. Both authors assume that “distances” cannot be part of species descriptions, “characters” are needed. I wonder if this is a scientific fact, or one that reflects the social norms of taxonomy. As discussed in recent posts, neighbor-joining distance comparisons show most animal species as tight clusters, distinct from those of other species. Once a reference library is established, why not use distance clustering as a diagnostic, eg “species X COI barcodes lie within cluster 1439″?  

Small houses on big lots

Thursday, September 21st, 2006

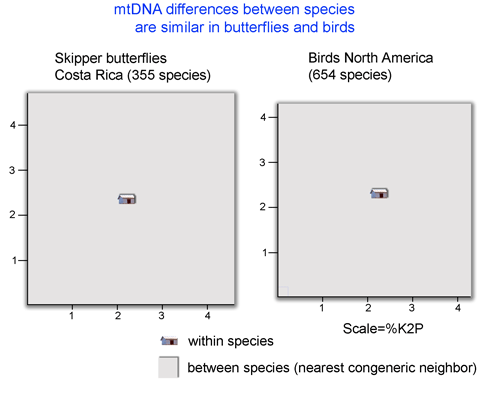
Most animal species correspond to tight clusters of mtDNA distinct from those closely-related species. In real estate terms, most species are small houses on big lots. Small houses because intraspecific variation in mtDNA is generally low, and big lots because distances between species are generally large. 


Two recent posts looked at “house size”, or mtDNA distances within species. The finding of limited variation within most species calls out for research into mitochondrial genetics. Here I examine the other half of what species-level mtDNA maps show: “lot size”, or mtDNA distances between species.  This refers to MINIMUM distances between species, ie the genetic distance between a species and its nearest neighbor on the mtDNA map. “Nearest neighbor” is more inclusive, and likely more appropriate for testing speciation/extinction models, than the subset of “sister species” which refers only to the most closely-related species pairs. Species without close relatives, and species whose closest relative belongs to another sister species pair are usually omitted from compilations of sister species.  

It is long observed that distances between most animal species are larger than distances within (eg Moore 1995 Evolution 49:718). What is exciting is that there is now enough barcode data to allow scientifically interesting comparisons among groups.  For example, the figure below shows average “lot size”, or minimum distance between species, is surprisingly similar in two large assemblages of butterflies and birds (nearest neighbor analysis performed using software and sequence data on Barcode of Life Data Systems (BOLD)).


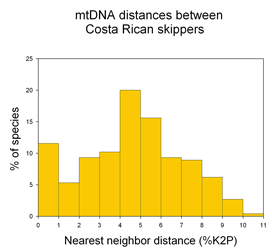
A potentially fruitful line of inquiry might be to examine nearest neighbor distances among allopatric vs. sympatric species. The distribution of nearest neighbor distances will likely be of interest to those studing birth and death of species (eg Nee 2001. Evolution 55:661). In the histogram of congeneric nearest neighbor distances among skipper butterflies shown at left, it is perhaps surprising the distribution is not a “hollow curve” (eg Scotland and Sanderson 2004. Science 303:643). Which models of speciation are consistent with observed distributions of genetic distances among species? 


Exploring unicellular eukaryotic universe with mtDNA

Thursday, September 14th, 2006

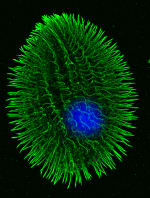
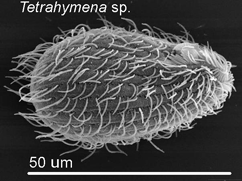
Tetrahymena sp Most DNA barcode research to date analyzes multicellular animals, but why stop there? Unicellular eukaryotes or “protists” probably comprise most of Earth’s biomass and encompass more genetic diversity than all multicellular animals and plants combined.  In current J Eukaryot Microbiol 2006 53:385 Denis Lynn and Michaela Struder-Kypke report on mitochondrial cytochrome oxidase I sequences in Tetrahymena, a ciliate protozoan genus related to Paramecium which includes T. thermophila, a model organism and the first free-living unicellular eukaryote genome sequenced. The authors analyzed 14 isolates of T. thermophila from 2 geographically distant locations, and 4 pairs of Tetrahymena sister species selected because they show NO sequence difference in nuclear small subunit ribsomal (SSrRNA) genes. They found less than 1% intraspecific sequence variation within T. thermophila isolates. Differences between species ranged from 1%-12% and the sister species pairs which have identical SSrRNA genes showed differences in mtCOI sequences. 

This early study suggests further exploration of unicellular eukaryotic biodiversity with COI barcodes will be fruitful. 


Growing libraries reinforce mtDNA sequence clustering

Thursday, September 7th, 2006

Growing barcode libraries confirm distinct clustering of mtDNA sequences. In early surveys of mtDNA differences, it seemed possible that as larger numbers of individuals were sampled, there would invevitably be many overlaps between closely-related species. The accumulating barcode data show this supposition is incorrect. Instead, further sampling reinforces the observation that most animal species correspond to distinct mtDNA sequence clusters, as for example, in the tree of Canada and Cackling Goose mtDNA sequences below (Figure A generated with public data files and software on Barcode of Life Database site https://www.barcodinglife.org/). Where large differences within species are found, they generally reflect the distinct sequence clusters of geographically restricted populations which have other identifiable biological differences, as in tree of Winter Wren mtDNA sequences below. Such clusters are probably best regarded as separate species (Figure B adapted from Drovetski et al 2004 Proc R Soc Lond B 271:545; number individuals sequenced shown in parentheses). 


An emerging corollary is that most named subspecies do not represent evolutionary significant units.   Large-scale surveys are revealing many genetically distinct clusters within named species, but these clusters generally do NOT correspond to described subspecies. For example, none of the 39 subspecies of Winter wren correspond to the geographic clades reported by Drovetski et al. and grouping by subspecies did not account for any variance. Robert Zink reports that “97% of continentally distributed avian subspecies lack the population genetic structure indicative of a distinct evolutionary unit” (Zink 2004 Proc R Soc Lond B 271:564). Regarding mtDNA sequence clusters, Zink states “it is these unnamed units and not named subspecies that should play a major role in guiding conservation efforts and in identifying biological diversity” Large-scale DNA barcode surveys of multicellular animals and plants can provide a foundation for intelligent conservation efforts. 


Contact: mark.stoeckle@rockefeller.edu

About this site

This web site is an outgrowth of the Taxonomy, DNA, and Barcode of Life meeting held at Banbury Center, Cold Spring Harbor Laboratory, September 9-12, 2003. It is designed and managed by Mark Stoeckle, Perrin Meyer, and Jason Yung at the Program for the Human Environment (PHE) at The Rockefeller University.

About the Program for the Human Environment

The involvement of the Program for the Human Environment in DNA barcoding dates to Jesse Ausubel's attendance in February 2002 at a conference in Nova Scotia organized by the Canadian Center for Marine Biodiversity. At the conference, Paul Hebert presented for the first time his concept of large-scale DNA barcoding for species identification. Impressed by the potential for this technology to address difficult challenges in the Census of Marine Life, Jesse agreed with Paul on encouraging a conference to explore the contribution taxonomy and DNA could make to the Census as well as other large-scale terrestrial efforts. In his capacity as a Program Director of the Sloan Foundation, Jesse turned to the Banbury Conference Center of Cold Spring Harbor Laboratory, whose leader Jan Witkowski prepared a strong proposal to explore both the scientific reliability of barcoding and the processes that might bring it to broad application. Concurrently, PHE researcher Mark Stoeckle began to work with the Hebert lab on analytic studies of barcoding in birds. Our involvement in barcoding now takes 3 forms: assisting the organizational development of the Consortium for the Barcode of Life and the Barcode of Life Initiative; contributing to the scientific development of the field, especially by studies in birds, and contributing to public understanding of the science and technology of barcoding and its applications through improved visualization techniques and preparation of brochures and other broadly accessible means, including this website. While the Sloan Foundation continues to support CBOL through a grant to the Smithsonian Institution, it does not provide financial support for barcoding research itself or support to the PHE for its research in this field.