In our Introduction we promised that loglets could analyze the rise, leveling and fall of competitors substituting for one another. The ``species'' do not have to be organisms in an ecosystem; rather, they can be technologies and products competing in a market. For example, we can think of different modes of transportation (horses, trains, cars, airplanes, etc.) as competing in the same market. Our discussion will focus on competing technologies rather than species.
The logistic substitution model describes the fraction of the niche or market share of the competitors. The life cycle of a competitor can be partitioned into three distinct phases: growth, saturation and decline. The growth and decline phases represent logistic growth processes, which as we will see, influences the saturation phase.
The assumptions behind the logistic substitution model, as developed by Nakicenovic and Marchetti[11,14], are:
The first assumption implies that growth can be modeled with an
S-shaped logistic. The fourth also implies that the decline phase can also
be modeled with a logistic with a negative ![]() . The second and
third allows us to determine saturation behavior by competition from emerging
technologies.
. The second and
third allows us to determine saturation behavior by competition from emerging
technologies.
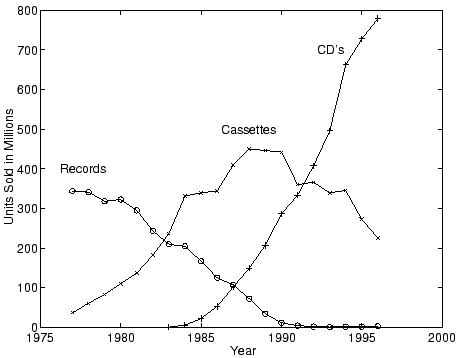
As an example, we apply the logistic substitution model to the American recording media market. (This example is also featured in the Tutorial; these data are included with the Loglet Lab software, along with other data which illustrate concepts of logistic analysis.) The shift in market dominance from vinyl records (LP's) to cassettes to compact discs (CD's) proved to be a remarkably orderly substitution, as can be seen in Figure 9. Figure 9 plots the number of LP's, cassettes, and CD's sold from 1977 to 1996. Because the logistic substitution model uses market shares as opposed to absolute shares, it is general enough to be useful for illustrating competition of species, products, or technologies in systems where the assumptions of logistic growth and decline hold.